Fig. 14.
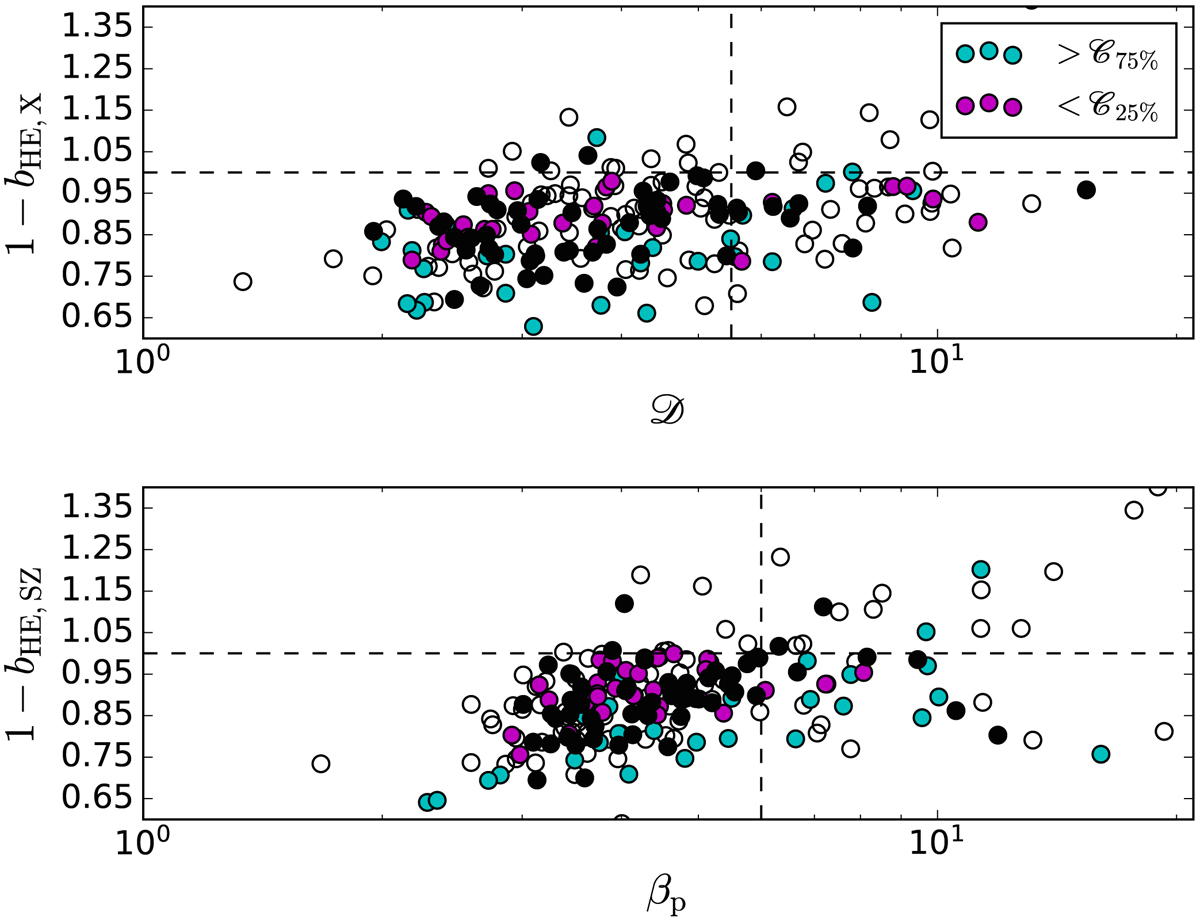
Mass biases (1 − bHE, X) and (1 − bHE, SZ) are shown as a function of the slope of the gas density, 𝒟, and of the pressure profile, βP. Empty and filled circles have the same meaning as in Fig. 13. Magenta points are well-fitted clusters with the lowest clumpiness values, the cyan points show those with the highest clumpiness values. The vertical lines represent the value 𝒟 = 5.5 and β = 6 which are approximately the 75th percentiles of the values of the two slopes. All quantities are measured in 3D so each cluster appears only once.
Current usage metrics show cumulative count of Article Views (full-text article views including HTML views, PDF and ePub downloads, according to the available data) and Abstracts Views on Vision4Press platform.
Data correspond to usage on the plateform after 2015. The current usage metrics is available 48-96 hours after online publication and is updated daily on week days.
Initial download of the metrics may take a while.