Fig. 11.
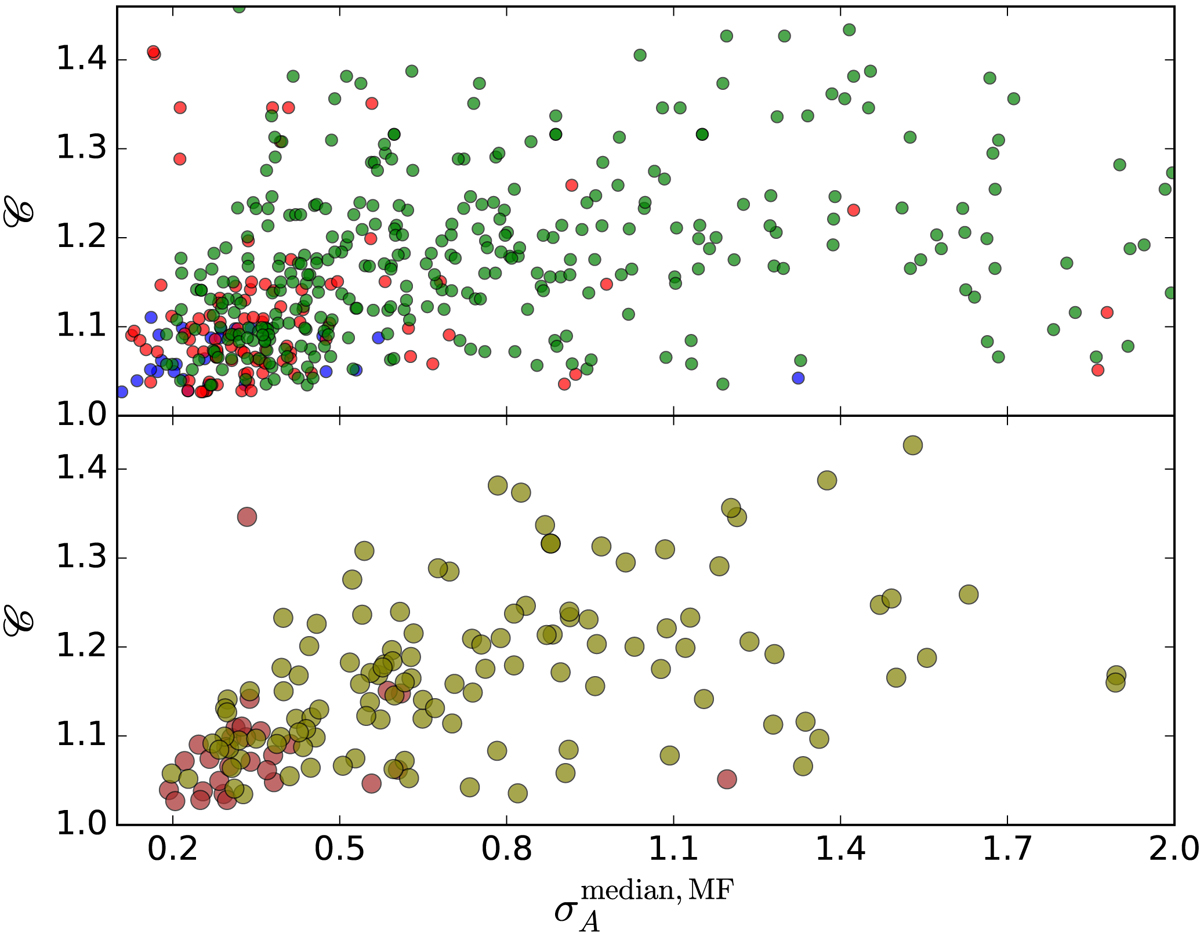
Clumpiness vs. azimuthal scatter computed around R500. Top panel: each σA refers to a separate map. The color code reflects the 2D classification: VR in blue, R in red, and IR in green. Bottom panel: each cluster is represented only once and the azimuthal scatter is averaged over all its considered projections, ⟨σA⟩. The R3D objects are shown in brown, and the IR3D clusters in olive green.
Current usage metrics show cumulative count of Article Views (full-text article views including HTML views, PDF and ePub downloads, according to the available data) and Abstracts Views on Vision4Press platform.
Data correspond to usage on the plateform after 2015. The current usage metrics is available 48-96 hours after online publication and is updated daily on week days.
Initial download of the metrics may take a while.