Open Access
Fig. 1.
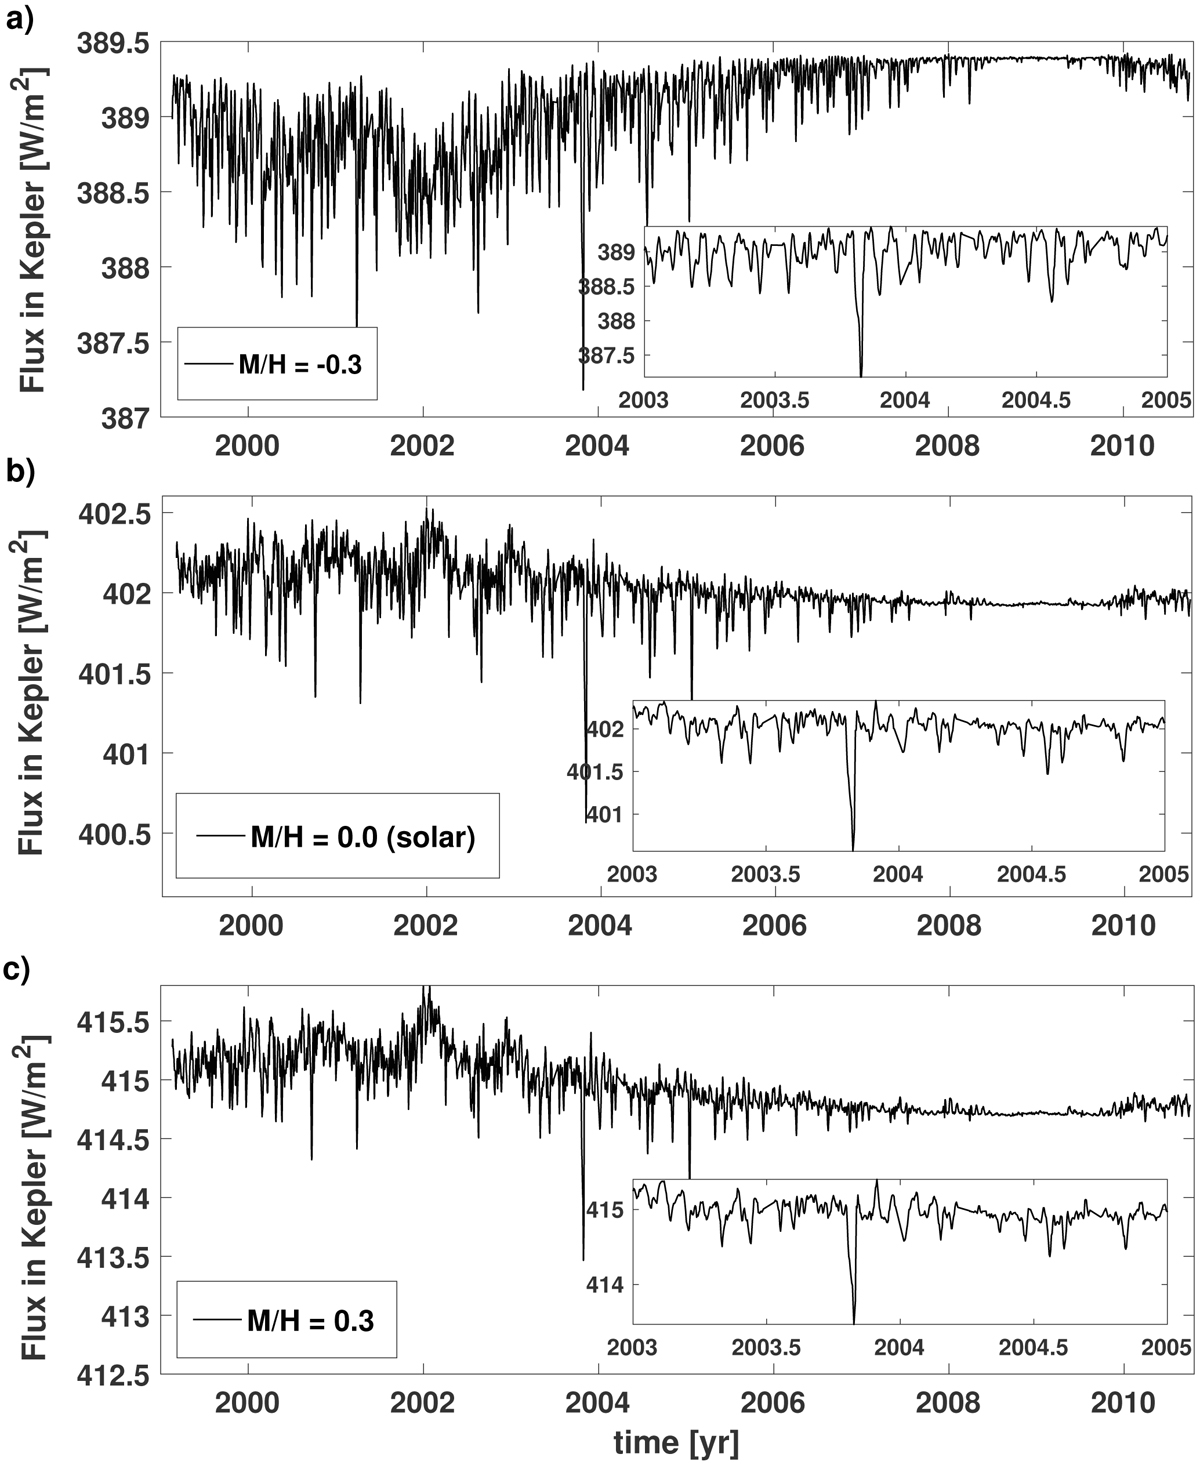
Model light curves for different M/H values in the Kepler pass band: (a) M/H = −0.3, (b) solar value, (c) M/H = 0.3. The insets show shorter time intervals to better visualise the rotational variability.
Current usage metrics show cumulative count of Article Views (full-text article views including HTML views, PDF and ePub downloads, according to the available data) and Abstracts Views on Vision4Press platform.
Data correspond to usage on the plateform after 2015. The current usage metrics is available 48-96 hours after online publication and is updated daily on week days.
Initial download of the metrics may take a while.