| Issue |
A&A
Volume 634, February 2020
|
|
|---|---|---|
| Article Number | A4 | |
| Number of page(s) | 11 | |
| Section | Cosmology (including clusters of galaxies) | |
| DOI | https://doi.org/10.1051/0004-6361/201936560 | |
| Published online | 28 January 2020 | |
Revived fossil plasma sources in galaxy clusters⋆
1
Leiden Observatory, Leiden University, PO Box 9513, 2300 RA Leiden, The Netherlands
e-mail: This email address is being protected from spambots. You need JavaScript enabled to view it.
2
International Centre for Radio Astronomy Research – Curtin University, GPO Box U1987, Perth, WA 6845, Australia
3
ASTRON, the Netherlands Institute for Radio Astronomy, Postbus 2, 7990 AA Dwingeloo, The Netherlands
4
INAF – IRA, Via P. Gobetti 101, 40129 Bologna, Italy
5
Dipartimento di Fisica e Astronomia, Università di Bologna, Via P. Gobetti 93/2, 40129 Bologna, Italy
6
Hamburger Sternwarte, Gojenbergsweg 112, 21029 Hamburg, Germany
7
Smithsonian Astrophysical Observatory, 60 Garden St., MS-4, Cambridge, MA 02138, USA
8
Centre for Astrophysics Research, School of Physics, Astronomy and Mathematics, University of Hertfordshire, College Lane, Hatfield AL10 9AB, UK
9
GEPI & USN, Observatoire de Paris, Université PSL, CNRS, 5 Place Jules Janssen, 92190 Meudon, France
10
Department of Physics & Electronics, Rhodes University, PO Box 94, Grahamstown 6140, South Africa
Received:
23
August
2019
Accepted:
3
November
2019
Abstract
It is well established that particle acceleration by shocks and turbulence in the intra-cluster medium can produce cluster-scale synchrotron emitting sources. However, the detailed physics of these particle acceleration processes is still not well understood. One of the main open questions is the role of fossil relativistic electrons that have been deposited in the intracluster medium (ICM) by radio galaxies. These synchrotron-emitting electrons are very difficult to study as their radiative lifetime is only tens of Myr at gigahertz frequencies, and they are therefore a relatively unexplored population. Despite the typical steep radio spectrum due to synchrotron losses, these fossil electrons are barely visible even at radio frequencies well below the gigahertz level. However, when a pocket of fossil radio plasma is compressed, it boosts the visibility at sub-gigahertz frequencies, creating what are known as radio phoenices. This compression can be the result of bulk motion and shocks in the ICM due to merger activity. In this paper we demonstrate the discovery potential of low-frequency radio sky surveys to find and study revived fossil plasma sources in galaxy clusters. We used the 150 MHz TIFR GMRT Sky Survey and the 1.4 GHz NVSS sky survey to identify candidate radio phoenices. A subset of three candidates was studied in detail using deep multi-band radio observations (LOFAR and GMRT), X-ray obserations (Chandra or XMM-Newton), and archival optical observations. Two of the three sources are new discoveries. Using these observations, we identified common observational properties (radio morphology, ultra-steep spectrum, X-ray luminosity, dynamical state) that will enable us to identify this class of sources more easily, and will help us to understand the physical origin of these sources.
Key words: radiation mechanisms: non-thermal / X-rays: galaxies: clusters / galaxies: clusters: individual: Abell 2593 / galaxies: clusters: individual: Abell 2048 / galaxies: clusters: individual: SDSS-C4-DR3-3088 / galaxies: clusters: intracluster medium
All reduced images are only available at the CDS via anonymous ftp to cdsarc.u-strasbg.fr (130.79.128.5) or via http://cdsarc.u-strasbg.fr/viz-bin/cat/J/A+A/634/A4
© ESO 2020
1. Introduction
Galaxy clusters are the largest gravitationally bound systems in the Universe. Their main mode of growth is through accretion of smaller groups of galaxies, and through major mergers with other clusters. A huge amount of gravitational binding energy of the order of ∼1064 ergs is released when galaxy clusters merge (e.g. Kravtsov & Borgani 2012). This energy strongly affects the physical properties of the different constituents of clusters (e.g. the density distribution and velocity dispersion of the galaxies) and the temperature, metallicity, and density distribution of the X-ray emitting thermal intracluster medium (ICM). Cluster mergers also generate shocks that cause density and temperature jumps (Markevitch & Vikhlinin 2007) and turbulence in the ICM, which can amplify magnetic fields (∼μG), affect the spatial transport, and (re)-accelerate relativistic particles (Lorentz factor γ > 1000). This particle acceleration can lead to cluster-scale synchrotron emission most commonly in the form of central radio halos and peripheral radio relics (see e.g. van Weeren et al. 2019 for recent observational reviews, and Brunetti & Jones 2014 for a theoretical review). The spectral index (α)1 of this emission is generally steep (α ≲ −1), making it relatively bright at radio frequencies below a few hundred MHz.
Radio halos are extended (≳1 Mpc) diffuse radio sources at the centre of merging clusters (e.g. Cassano et al. 2010; Cuciti et al. 2015; Kale et al. 2015), with a morphology similar to the X-ray morphology of the system. Radio halos have been discovered in ∼50 disturbed clusters (e.g. van Weeren et al. 2019). Observational evidence collected in the last decade suggests that they are caused by the continuous acceleration of electrons in turbulent gas (Brunetti et al. 2001; Petrosian 2001; Brunetti & Lazarian 2007). In addition, continuous injection of secondary particles through proton-proton collisions (Dennison 1980; Enßlin et al. 2011) can be re-accelerated together with the primary electrons (Brunetti & Lazarian 2011; Pinzke et al. 2017) in these regions, and may play a role in the generation of radio halos. However, the lack of gamma ray detection puts constraints on such a mechanism (e.g. Brunetti et al. 2017 and references therein).
Apart from radio halos, diffuse radio sources in clusters can be broadly divided into radio relics (e.g. Kempner et al. 2004; van Weeren et al. 2019) and radio phoenices (revived fossil plasma sources). Cluster radio relics are elongated linearly polarised (> 10%−30% at GHz frequencies) regions (∼1−2 Mpc) at the cluster outskirts, which typically have a convex morphology with respect to the cluster centre and exhibit a radio spectral steepening towards the cluster centre (van Weeren et al. 2010; Bonafede et al. 2012; Stroe et al. 2013; de Gasperin et al. 2015; Kierdorf et al. 2017). Radio relics are generally found to trace merger-induced shock waves (e.g. Finoguenov et al. 2010; Bourdin et al. 2013; Akamatsu & Kawahara 2013; Shimwell et al. 2015; Botteon et al. 2016; Eckert et al. 2016; Urdampilleta et al. 2018). The particle (re)-acceleration processes at the location of radio relics is still debated. There are cases where the luminosity of the radio relics is much higher than expected from diffuse shock acceleration (DSA) of electrons in the thermal pool (e.g. Brunetti & Jones 2014; Botteon et al. 2016, 2020; van Weeren et al. 2016a). Therefore, the role of fossil plasma (seed particles) in the ICM has been invoked, as simulations indicate that (re)-acceleration of seed relativistic electrons is more efficient than the DSA (e.g. Kang & Ryu 2015).
Radio phoenices are a less widely studied class of diffuse radio sources in the ICM, and are thought to be a manifestation of fossil plasma in galaxy clusters. Likely candidates for the fossil electrons are lobes and tails of radio galaxies, which have ultra-steep spectra (USS) due to synchrotron aging and inverse Compton (IC) losses. After being deposited in the ICM, these fossil electrons are visible only for tens of Myr at GHz frequencies. When an aged lobe or tail is compressed (e.g. by a merger shock), the electrons are re-energised which boosts their visibility at sub-GHz frequencies (Enßlin & Gopal-Krishna 2001; Enßlin & Brüggen 2002). Sources powered by this mechanism can maintain electrons at higher energies than what radiative cooling alone would allow. Although deposited locally, when given enough time, fossil plasma can occupy a significant fraction of the (turbulent) ICM due to advection and diffusion. The relative importance of this mechanism to explain the origin of the other diffuse cluster radio sources (halos, relics) is unclear. To date, only a few radio phoenices have been found using low-frequency observations of clusters (e.g. Slee et al. 2001; Kempner et al. 2004; van Weeren et al. 2009, 2011; de Gasperin et al. 2015; Mandal et al. 2019). Even though radio tails and lobes are abundant in clusters, the ultra-steep nature of these sources makes it hard to identify, especially from large-area sky surveys at GHz frequencies. To firmly establish radio phoenices as a distinct class of objects, it is crucial to identify their common observable and physical properties for comparison with radio halos and relics. Identifying common observational properties also enables an efficient search for more radio phoenices, which in itself will help us to better understand the nature and physical mechanisms behind this relatively unexplored population of radio sources.
Radio sky surveys below 300 MHz such as the VLA Low-frequency Sky Survey (VLSS; Cohen et al. 2007; Lane et al. 2012, 2014), the GaLactic and Extragalactic All-sky Murchison Wide-field Array Survey (GLEAM; Wayth et al. 2015; Hurley-Walker et al. 2017), and the LOFAR Multi-frequency Snapshot Sky Survey (MSSS; Heald et al. 2015) have a great potential for discovery in this area, but the low spatial resolution of these surveys makes it difficult to distinguish between diffuse radio emission and emission from individual active radio galaxies. The TIFR GMRT Sky Survey (TGSS ADR; Intema et al. 2017) is a high-resolution sky survey at 150 MHz. The combination of very large area (about 37 000 square degrees, all radio sky between −53° and +90°), high resolution (25″), and high sensitivity (2−5 mJy beam−1 rms noise) makes the TGSS a very suitable resource to search for radio phoenices based on their diffuse morphology, ultra-steep radio spectrum, and location in galaxy clusters.
In this paper we present a pilot study for identifying the properties of radio phoenices and their interplay with the dynamics and properties of the hosting clusters from multi-band radio observations, complemented with optical and X-ray observations. We selected 11 radio phoenix candidates from the TGSS based on their morphology, steep spectra, and location (see Sect. 2). For three of the candidates, we were able to obtain data sets at three different radio (LOFAR 150 MHz, GMRT 325 MHz, and 610 MHz) and X-ray (Chandra or XMM-Newton) bands, which we present in this paper as an exploratory study. The layout of the paper is as follows. In Sect. 2 we present the method of the sample selection. In Sect. 3 we describe the observations and data reduction methods. In Sect. 4 we discuss the results deduced from the radio, X-ray, optical, and spectral index images of these sources, followed by a discussion in Sect. 5 and our conclusions in Sect. 6.
Throughout the paper we assume a ΛCDM cosmology with H0 = 70 kms−1 Mpc−1, Ωm = 0.3, and ΩΛ = 0.7. All sky coordinates are epoch J2000 coordinates.
2. Sample selection
To search for candidate radio phoenices in galaxy clusters, we convolved the TGSS images (resolution 25″) to the resolution of the NRAO VLA Sky Survey (NVSS; Condon et al. 1998: resolution 45″) images, combined the two, and identified extended steep-spectrum emission. We selected sources based on the following properties:
-
An ultra-steep radio spectrum (α ≤ −2);
-
A 150 MHz total flux density S150 ≥ 30 mJy (detection above ∼10σ);
-
A morphology compatible with diffuse cluster emission (no point sources associated with dead active galactic nuclei (AGNs);
-
Located in the vicinity (within 1 Mpc) of a known cluster position from the SDSS cluster catalogue by Wen et al. (2012) or the ROSAT All-Sky Survey (RASS; Voges et al. 1999) catalogue.
The limiting values of the spectral index and flux density in selecting the sample is somewhat arbitrary, aimed at identifying very steep-spectrum, extended, and relatively bright candidates to enable a more detailed study using follow-up observations. This bright sample is likely the tip of the iceberg of the population, and in this way the contamination of other types of sources (such as radio relics and halos) is also minimal. Our final sample consists of 11 candidate revived fossil plasma sources. For this study we performed follow-up observations for three of the sources with LOFAR 150 MHz, GMRT 325 MHz, GMRT 610 MHz, and Chandra and/or XMM-Newton X-ray observations. An overview of these three objects is given in Table 1. The detailed observation summary is given in Table 2. The remainder of our sample will be followed up with future observations.
Target list of three TGSS clusters with their properties, as given in the literature.
Observation details (on-source time) of Abell 2593, SDSS-C4-DR3-3088 and Abell 2048.
3. Observations and methods
3.1. GMRT data reduction
We observed two of our targets (Abell 2593 and SDSS-C4-DR3-3088) with the GMRT at 325 and 610 MHz (project codes 31_018 and 33_014), while for the third target (Abell 2048) we used archival observations at the same frequencies (project codes 15HRA01 and 16_065). The data were processed using the SPAM pipeline (Intema et al. 2017), which includes radio frequency interference (RFI) mitigation schemes, direction-dependent calibration, and ionospheric modelling (Intema et al. 2009). The final full-resolution GMRT images are shown in the middle panels of Figs. 1–3, and were created using the imaging parameters listed in Table 3. The flux densities were set using calibration on 3C286 (at 325 MHz) and 3C48 (at 610 MHz) using the models from Scaife & Heald (2012). We adopted a flux uncertainty of 10% for GMRT observations (Chandra et al. 2004), which is quadratically added to the uncertainties of all flux density measurements from the GMRT observations.
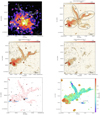 |
Fig. 1. Top left panel: full-resolution LOFAR image contours (white; as shown in the right panel) of Abell 2593, overlaid on an exposure-corrected Chandra image in the 0.5−2.0 keV energy band with a total integration time of 7 ks. Top right panel: 150 MHz LOFAR image (9″ × 6″). The black contours and dashed lines show the (1,2,4,...) × 5 × σLOFAR150 and −3 × σLOFAR150 levels, respectively, where σLOFAR150 = 219 μJy beam−1. Middle left panel: 325 MHz GMRT image (11″ × 7″). The black contours and dashed lines show the (1,2,4,...) × 5 × σGMRT325 and −3 × σGMRT325 levels, respectively, where σGMRT325 = 66 μJy beam−1. Middle right panel: 610 MHz GMRT image (5″ × 4″). The black contours and dashed lines show the (1,2,4,...) × 5 × σGMRT610 and −3 × σGMRT610 levels, respectively, where σGMRT610 = 38 μJy beam−1. Bottom left panel: LOFAR 150 MHz contours (shown in the top left panel) in red overlaid on an SDSS r-band image of Abell 2593. The labelled galaxies (RG1-A and RG2-A) are the possible counterparts for the radio emission of regions A and C. The BCG label indicates the brightest cluster galaxy. Bottom right panel: LOFAR 150 MHz contours (shown in the top right panel) overplotted on the high-resolution (20″ × 20″) spectral index map of Abell 2593. |
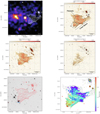 |
Fig. 2. Top left panel: full-resolution LOFAR image contours (white; as shown in the right panel) of SDSS-C4-DR3-3088, overlaid on an exposure-corrected Chandra image in the 0.5−2.0 keV energy band with a total integration time of 17 ks. Top right panel: 150 MHz LOFAR image of SDSS-C4-DR3-3088 (6″ × 6″). The black contours and dashed lines show the (1,2,4,...) × 5 × σLOFAR150 and −3 × σLOFAR150 levels, respectively, where σLOFAR150 = 80 μJy beam−1. Middle left panel: 325 MHz GMRT image (13″ × 7″). The black contours and dashed lines show the (1,2,4,...) × 5 × σGMRT325 and −3 × σGMRT325 levels, respectively, where σGMRT325 = 43 μJy beam−1. Middle right panel: 610 MHz GMRT image (6″ × 4″). The black contours and dashed lines show the (1,2,4,...) × 5 × σGMRT610 and −3 × σGMRT610 levels, respectively, where σGMRT610 = 40 μJy beam−1. Bottom left panel: LOFAR 150 MHz contours (shown in left panel in red) overlaid on an SDSS r-band image of SDSS-C4-DR3-3088. A possible optical counterpart is labelled RG-A. Bottom right panel: LOFAR 150 MHz contours (shown in the top right panel) overplotted on the high-resolution (7″ × 7″) spectral index map of SDSS-C4-DR3-3088. |
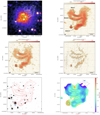 |
Fig. 3. Top left panel: full-resolution LOFAR image contours (white; shown in the top right panel) of Abell 2048, overlaid on an exposure-corrected background-subtracted XMM-Newton image in the 0.5−2.0 keV energy band with a total integration time of 68 ks. Top right panel: 150 MHz LOFAR image (13″ × 6″) of the source Abell 2048. The black contours and dashed lines show the (1,2,4,...) × 5 × σLOFAR150 and −3 × σLOFAR150 levels, respectively, where σLOFAR150 = 266 μJy beam−1. Middle left panel: 325 MHz GMRT image (11″ × 8″) of Abell 2048. The black contours and dashed lines show the (1,2,4,...) × 5 × σGMRT325 and −3 × σGMRT325 levels, respectively, where σGMRT325 = 125 μJy beam−1. Middle right panel: 610 MHz GMRT image (8″ × 5″) of Abell 2048. The black contours and dashed lines show the (1,2,4,...) ×5 × σGMRT610 and −3 × σGMRT610 levels, respectively, where σGMRT610 = 117 μJy beam−1. Bottom left panel: LOFAR 150 MHz contours (shown in the left panel in red) overlaid on an DSS2 r-band image of Abell 2048. A possible optical counterpart is labelled RG. Bottom right panel: LOFAR 150 MHz contours (shown in the top right panel) overplotted on the high-resolution (20″ × 20″) spectral index map of Abell 2048. |
Imaging parameters and image properties of the LOFAR and GMRT maps of Abell 2593, SDSS-C4-DR3-3088, and Abell 2048.
3.2. LOFAR data reduction
All three sources presented in this paper were observed with the LOFAR at 150 MHz (project codes LC9_027 for Abell 2593 & Abell 2048, and LC6_015 for SDSS-C4-DR3-3088) in HBA_DUAL_INNER mode. The LOFAR data were processed with the standard direction-independent (DI) calibration pipeline2 as described in van Weeren et al. (2016a) and Williams et al. (2016) to correct for DI effects (see de Gasperin et al. 2019 for a description of the latest version of this pipeline). The processing was performed on computer facilities that are local to the LOFAR long-term archive sites to mitigate issues with downloading large quantities of data to local compute clusters (see Mechev et al. 2018). After DI calibration was completed, the data were processed with the latest version of the LoTSS (Shimwell et al. 2017, 2019) direction-dependent (DD) calibration and imaging pipeline that will be presented in detail in Tasse et al. (in prep.) and is also summarised in Shimwell et al. (2019, Sect. 5.1). This pipeline makes use of kMS (Tasse 2014; Smirnov & Tasse 2015) for DD calibration, and DDFacet (Tasse et al. 2018) is used to apply the DD calibration solutions during the imaging.
After completion of the LoTSS data processing pipeline, a post-processing step is conducted to subtract all the sources except for the targets and to calibrate in the directions of the targets. This post-processing procedure will be described in van Weeren et al. (in prep.).
Due to normalisation issues and inaccurate beam models, LOFAR flux scales can show systematic offsets that need to be corrected by comparison with other surveys (van Weeren et al. 2016b; Hardcastle et al. 2016). We cross-matched catalogues of LOFAR point sources near the targets with the TGSS (Intema et al. 2017). The adopted correction factor is approximately 15% on the LOFAR flux densities that were derived from the total flux density ratio between the LOFAR and the TGSS.
3.3. Spectral index maps and integrated spectrum calculation
In Table 3 we list the properties of the images made with the radio data. These images were used to create high-resolution spectral index maps for 150 MHz, 325 MHz, and 610 MHz. In order to sample the same spatial scales at all frequencies, we remade the images using the same inner uv-range of 200λ for all the radio frequencies. Only for Abell 2048 was an inner uv-range of 600λ used to suppress ripples caused by calibration errors on shorter baselines. The uv-taper parameter was varied for individual data sets (see Table 3). The resulting images were convolved with a 2D Gaussian to produce images with the same restoring beam size, accurately aligned in the image plane, and re-gridded onto the same pixel grid. To calculate the spectral index maps, only pixels with a surface brightness > 3σ that were detected in at least two images were used (where σ is the local rms background noise). These masked images were then used to create spectral index maps where a power-law function was fit for each pixel. The errors in the spectral index were calculated taking into account the image noise and a flux scale uncertainty of 15% for LOFAR and 10% for GMRT. Spectral index error maps are included in Appendices A and B.
3.4. X-ray data reduction
Abell 2593 and SDSS-C4-DR3-3088 were observed with Chandra ACIS-I in VFAINT mode as part of the GTO program (Obs IDs 20780 and 20781). Abell 2048 was already observed twice with EPIC on board XMM-Newton in full-frame mode (Obs IDs 0653810601 and 0760230301). We retrieved these data sets (see Table 2 for more details) and analysed the Chandra data with CIAO v4.11 and CALDB v4.8.2, while we made use of the ESAS implemented in SAS v16.1.0 to process the XMM-Newton data. The observations were reduced following standard reduction procedures, including the removal of bad pixels, screening for periods affected by soft proton flares, and detection and excision of point sources prior to spectral extraction. We used the 0.5−2.0 keV energy band to produce the cluster images shown in this paper.
Spectral analysis was performed with XSPEC v12.10.0c (Arnaud 1996) to derive global properties of the clusters. Given the low redshifts of Abell 2593 and SDSS-C4-DR3-3088 and their large angular extent in the ACIS-I field of view (FoV), we made use of the Chandra blank sky field data sets scaled by the ratio of the 9.5−12 keV count rates to estimate the local background. The larger FoV of XMM-Newton and smaller angular size of Abell 2048 allowed us to perform accurate modelling of the background components in a cluster-free region. We followed Ghirardini et al. (2019), adopting their phenomenological model for the non-X-ray background and an astrophysical component composed of the combined cosmic X-ray background together with the Galactic foreground emission in the direction of the cluster. The ICM emission was modelled with an absorbed thermal plasma model PHABS*APEC, fixing the redshift of the cluster to the value given in Table 1 and the column density to the Galactic absorption value towards the target (Kalberla et al. 2005). The normalisation, temperature, and metallicity (solar abundance table by Asplund et al. 2009) of the APEC model were free to vary in the fit.
Derivation of the cluster global properties. We derived the global temperature and metallicity of the clusters from spectra extracted in the region 0.1 × R500 < r < 0.4 × R500, a choice that is commonly used in the literature to avoid the effect of the cool core (if present), and obtained values at the virial radius. As R500 is not known for our clusters, we used an iterative approach to compute ⟨kT⟩ and R500 (see Liu et al. 2018; Mernier et al. 2019): we first fixed R500 arbitrarily and evaluated the corresponding ⟨kT⟩, then we used the scaling relations of Arnaud et al. (2005) to compute R500 (and M500) and compared it with the new ⟨kT⟩ obtained until we obtained a self-consistent result. The global properties of the clusters are summarised in Table 4.
Global properties of the clusters derived from X-ray observations.
4. Results
Our three radio phoenix candidates are associated with the clusters as listed in Table 1. A list of global cluster properties (temperature, metallicity, R500, and M500) as derived from the X-ray observations is provided in Table 4. We first discuss the results for the three individual radio sources in their respective clusters.
4.1. Abell 2593
The galaxy cluster Abell 2593 is located at a redshift of z = 0.041 with an Abell richness class of R = 0 (Ulmer et al. 1981). The top left panel of Fig. 1 shows the image of the X-ray gas overplotted with the contours of the 150 MHz radio emission (in white) as seen by LOFAR. The morphology of the X-ray emission appears roundish and we do not see strong evidence for elongation of the emission in any particular direction, as is typically the case for merging clusters. However, the X-ray emission is not peaked at the centre, suggesting that the dynamical state could be somewhat disturbed.
The radio source in this cluster has a filamentary morphology with distinctive features. The top right panel shows the high-resolution LOFAR 150 MHz image of the source that extends 450 kpc in the SE-NW direction (labelled regions A and C), and an elongated structure extending about 200 kpc in the NE direction (region B). There is a hint of diffuse emission towards the SW (region D). The middle left and right panels of Fig. 1 show the GMRT 325 and 610 MHz images, respectively. The GMRT 325 MHz image has a very similar morphology to the LOFAR 150 MHz image, but there is an apparent disconnection towards the south of region B. Region A has a similar morphology in the GMRT 610 MHz image as well, but we do not detect the significant emission in regions B and D. In addition, the radio emission in region C is very faint in the GMRT 610 MHz image, which is indicative of steep-spectrum radio emission. The bottom left panel shows the LOFAR 150 MHz contours (in red) overlaid on an SDSS r-band image (Wen et al. 2012) of Abell 2593. The brightest cluster galaxy (labelled BCG) is associated with a compact radio source visible in all three radio maps. Two other optical galaxies (RG1-A and RG2-A) are also found to be associated with radio emission. The peak of the X-ray emission coincides with the BCG position. Given that it is a poor cluster of galaxies (since it is of low mass), it is hard to determine the dynamical state of the cluster based on very few galaxy cluster members.
In order to measure the integrated radio spectral index of the different regions of the radio emission Abell 2593, we made a set of images (not included in this paper) at all available radio frequencies with identical imaging parameters and minimum uv-range (see Sect. 3.3 for details). The integrated flux densities of the whole source measured over the same area (defined by the 3σ contours of the LOFAR image) at 150 MHz, 325 MHz, and 610 MHz are S150 = 3.57 ± 0.36 Jy, S325 = 1.45 ± 0.15 Jy, and S610 = 0.69 ± 0.07 Jy, respectively. A single power-law fit gives an integrated spectral index measurement of α150 − 325 − 610 = −1.17 ± 0.12. This is less steep than the integrated spectral index measured between 150 MHz TGSS and 1.4 GHz NVSS flux densities. This apparent discrepancy is discussed in Sect. 5. We used the LOFAR 150 MHz, GMRT 325, and 610 MHz maps to create a spatially resolved spectral index map (see Sect. 3.3) to look for trends in the variation of α at a resolution of 20″. The bottom right panel of Fig. 1 shows the spectral index distribution across the source. The spectral index values at the location of RG1-A and RG2-A (region A) are −0.8 (flat). For the source RG1-A, the spectral index steepens in the NW direction to a value of −1.7. Regions B and C are more uniformly steep with small variations ranging from −1.7 to −2.0. Region D has a very steep spectral index value of −3.0. We note that the compact radio emission from the BCG has a spectral index of −0.7.
The integrated spectral index value of the entire source from 150 MHz to 325 MHz–610 MHz is not very steep due to the contributions of the radio flux at the location of RG1-A, RG2-A, and the BCG and is not an accurate representation of the spectral index of the diffuse regions of the source. The spectral index value tends to get steeper when we add flux density measurements from 1.4 GHz NVSS images, which suggests a possibly curved spectrum at higher frequencies. However, deeper 1.4 GHz observations are needed in order to confirm the spectral curvature.
4.2. SDSS-C4-DR3-3088
The galaxy cluster SDSS-C4-DR3-3088 is located at a redshift of z = 0.046. Sixty-one cluster members were spectroscopically confirmed by Simard et al. (2009). The top left panel of Fig. 2 shows the 150 MHz LOFAR image contours overlaid on our Chandra X-ray image. The peak in the diffuse X-ray emission resides towards the east of the radio source at a large distance of 500 kpc (labelled as the “X-ray peak”). We note that this peak is due to the contribution from a point source (CGCG 265-040, z = 0.047; Yang et al. 2007). Since the X-ray emission is irregular in morphology, it suggests that the cluster could be dynamically disturbed.
The top right panel shows the 150 MHz LOFAR image of the radio source. The middle left and right panels show the GMRT 325 and 610 MHz images, respectively. In all the images the radio source has an irregular filamentary morphology with what looks to be a wide-angle radio tail. Regions of interest have been indicated on the LOFAR 150 MHz image. Starting from region A, the source extends about 400 kpc in the NW direction. There is a linear feature along the edge of the source 500 kpc in length. In the LOFAR 150 MHz image, this linear feature appears to be connected to a compact source (labelled RG). However, this extension of the diffuse emission is not recovered in the GMRT 325 MHz and 610 MHz images, suggesting that it is steep-spectrum emission. The central “Filaments” region is detected at all radio frequencies. The radio source gives of an oddly shaped radio tail wedge with RG-A in its focus. The morphological connection of RG-A with the larger scale radio emission is persistent across all radio frequency bands, which strongly suggests a physical connection. The bottom left panel of Fig. 2 shows the SDSS r-band image of the cluster overlaid with the LOFAR 150 MHz contours in red. We do not identify any optical counterpart to the compact radio source RG (see top right panel). Given the fairly low redshift of the cluster (z = 0.046), this likely means that the compact radio source is a background object at higher redshift, and the apparent connection with the diffuse emission at 150 MHz is a chance alignment. We find an optical galaxy at the location of RG-A, which we identify as its host. The brightest cluster galaxy is located near the peak in the X-ray emission (outside the extent of the optical image).
To measure the integrated spectral index of the source, a set of new images was made with the same uv-range in order to match same spatial scales in all available radio frequencies (see Sect. 3.3 for details). The measured integrated flux densities of the source over exactly the same area (defined by the 3σ contours of the LOFAR image) at 150 MHz, 325 MHz, and 610 MHz are S150 = 1.83 ± 0.18 Jy, S325 = 0.45 ± 0.50 Jy, and S610 = 0.16 ± 0.02 Jy. A single power-law fit gives an integrated spectral index measurement of α150 − 610 = −1.74 ± 0.23. We also used the NVSS image to calculate the total flux density and adding this extra frequency point; the single power-law fit gives an integrated spectral index measurement of α150 − 1400 = −2.00 ± 0.06. This suggests that there could be a hint of curvature at the higher frequency. To create a high-resolution (7″) spectral index map (same method as in Sect. 3.4), we only used the LOFAR 150 MHz and 610 MHz (excluding the GMRT 325 MHz map), which is shown in Fig. 2, bottom right panel. The spectral index at the location of the optical host galaxy RG-A is −0.8. The spectral index steepens in the NW direction over a distance of 100 kpc (region A) to a value of −1.3. The filaments have an overall steep spectral index distribution that is flatter than the surrounding diffuse emission. The linear feature has a spectral index value ranging from −1.3 to −1.5 prior to the “Filaments” region. The diffuse emission apparently connecting to the source RG (Fig. 2 left panel) has the steepest spectral index with a value of −3.0 (see Appendix B for additional spectral index maps).
4.3. Abell 2048
Abell 2048 is a galaxy cluster located at a redshift of z = 0.0972 (Struble & Rood 1999). The top left panel of Fig. 3 shows the LOFAR 150 MHz contours (in white) overplotted on a background-corrected XMM-Newton X-ray image. The brightest cluster galaxy of the system is labelled BCG (and lies outside the extend of the radio and optical images). The morphology of the X-ray emission is slightly elongated along the NW-SE direction and is not strongly peaked at the centre. This could indicate that the dynamical state of this cluster is disturbed.
The steep-spectrum radio source is located at the outskirts of the cluster. The top right panel in Fig. 3 shows the 150 MHz LOFAR image of the filamentary radio source with a complex morphology. The largest extent of the source is 400 kpc. Three distinctive arm-like features are marked in the same figure. There is a hint of a connection between the extension of “Arm-3” and the compact source labelled “RG”. In the middle panel we show the GMRT 325 MHz and GMRT 610 MHz images in the left and right panel, respectively. At 610 MHz most of the diffuse emission in the arms is faint, suggesting it has a very steep radio spectrum. van Weeren et al. (2011) presented the VLA 1.4 GHz image in “C” configuration, which confirms the steep nature of the diffuse emission, and set an upper limit on the polarisation fraction of 8% for the source.
The bottom left panel shows the optical DSS2 r-band image of the cluster overlaid with the LOFAR 150 MHz contours in red. We identified the elliptical galaxy MCG+01–39–011 (z = 0.095) as the host of the radio source RG based on accurate co-location. There are no other obvious optical counterparts associated with the radio emission in the arms, although several cluster galaxies lie within the arm areas.
In order to measure the spectral properties of the radio source in Abell 2048, we used the same uv-range to re-image the data set in all available radio frequencies (see Sect. 3.3 for details). The measured integrated flux densities of the source are S150 = 1.57 ± 0.25 Jy, S325 = 0.50 ± 0.05 Jy, and S610 = 0.17 ± 0.02 Jy as measured at 150 MHz, 325 MHz, and 610 MHz, respectively. A single power-law fit gives an integrated spectral index measurement of α150 − 610 = −1.59 ± 0.17. We also recalculated the integrated spectral index value by adding the 1.4 GHz VLA total flux density measurement (from van Weeren et al. 2011). The resulting value of α150 − 1400 = −1.94 ± 0.20 suggests that the radio source possibly has a curved spectrum. We re-imaged the LOFAR and GMRT observations to make a high-resolution spectral index map, which is shown in Fig. 3 (bottom left panel). The value of the spectral index is uniformly steep (on average) in the arm regions with α = −1.65 ± 0.10 with small variations. No particular trend (flattening or steepening) of the spectral index is noticed along any direction. The spectral index of the source RG is flat with a value of α = −0.8.
5. Discussion
In this paper, we present a multi-wavelength study of three ultra-steep spectrum diffuse radio sources in galaxy clusters. The morphology of these sources does not fit with a scenario in which they are mere aged confined bubbles from AGNs in the ICM. Also, the spectral index shows patchy structures with no clear trend within the source. In addition, the kinematic age (travel time of the electrons in the ICM) of the source (∼gigayear) is much larger than the radiative lifetime (∼megayear) of the electrons; which suggests re-energisation of the electrons occurs at the location. Although limited in numbers, this study aims to explore the properties of this relatively unexplored class of sources to look at possible common characteristics and the connection with the dynamical properties of the hosting cluster. Below we discuss the common physical properties of these sources based on these observations.
5.1. AGN connection
All these sources show a very filamentary, irregular morphology at low radio frequencies. As shown in the results section, these sources are morphologically connected with an AGN: RG1-A, RG2-A for Abell 2593; RG-A for SDSS-C4-DR3-3088; and RG for Abell 2048. Spectral index values at these locations are of the order of −0.7, which is in agreement with the injection spectral index of an AGN, and the spectral index tends to steepen along the tail of the radio galaxy.
5.2. Spectral index
The three sources have an overall ultra-steep radio spectrum. The relatively strong low-frequency emission traces an old population of electrons because high-energy electrons age due to synchrotron and IC losses and are visible only for tens of Myr. Old lobes of radio galaxies (AGNs) are one of the main candidates for these fossil plasma. The measured integrated spectral index for 150 MHz, 325 MHz, and 610 MHz is less steep than the index measured for 150 MHz, 325 MHz, 610 MHz, and 1400 MHz (see Sect. 4.1), which suggests that there might be curvature towards higher frequencies. Deep observations at 1.4 GHz are needed to confirm this. It is important to note that all the sources have a non-uniform spectral index across the source. This suggests that there could be a possible mix of cosmic-ray populations with different ages, losses, and re-acceleration efficiencies. Therefore, the re-energisation of these particles can also be different across the source. So, even though there is a hint of curvature in the integrated spectral index, the sources should not be interpreted as a reservoir of homogeneous cosmic-ray population. In addition, we note that the integrated spectral indices of these sources are much steeper than the classical radio relics (Feretti et al. 2012).
5.3. Mass, temperature, dynamical state, and position of the radio source in the cluster
In Table 4 we list the derived mass and the global temperature of each galaxy cluster, which shows that they are only moderately massive (M500 < 1015 M⊙). Most of the previously discovered radio phoenix candidates (apart from the one in Abell 1914; Mandal et al. 2019) tend to be located in less massive systems of galaxy clusters. In the same table we see that the radio sources reside well within the R500 value and extend about 500 kpc. This means that the radio sources are located within the ICM towards the cluster centre. Deeper X-ray observations are needed in order to map the temperature in different regions and characterise the merger dynamics more accurately. However, the apparent disturbed morphologies of these clusters suggest that the systems could be unrelaxed and undergoing minor mergers. Although radio phoenix candidates with highly disturbed clusters also exist (e.g. Abell 1914 and Abell 2443; Mandal et al. 2019; Clarke et al. 2013), a clear connection of a shock with a radio phoenix is still missing.
Interpretation. Ultra-steep spectrum radio sources in clusters with complex filamentary morphologies have sporadically been seen in previous studies (e.g. Slee et al. 2001; Kempner et al. 2004) and were characterised as relic or ghost radio galaxies and proposed to name these radio phoenices. It has been speculated that the origin of these sources are AGNs. Slee et al. (2001) showed that the estimated travel time of the brightest cluster galaxies are much longer than the modelled ages of relic radio sources, and a nearby bright elliptical galaxy always provided a decent match as a candidate source of origin. Based on our observations and results, the sources presented in this paper also appear to belong to the same class of objects.
Shocks and ICM motion can affect the morphology of ghost plasma or bubbles. Recent simulations of cluster radio galaxy tails, passing through ICM shocks or with large relative motions, show filamentary morphologies and ultra-steep and curved spectra (Nolting et al. 2019) similar to what is observed. Earlier it was proposed that shocks can compress the radio plasma if it is still poorly mixed with the ICM. This compression re-energises the electrons to boost their visibility at frequencies below a few hundred MHz (Enßlin & Gopal-Krishna 2001; Enßlin & Brüggen 2002).
Another scenario for the formation of these ultra-steep spectrum sources in clusters invokes shock re-acceleration of fossil plasma through the Fermi-I mechanism (DSA; e.g. Kang & Ryu 2015). This will flatten the curved radio spectrum and if the shock is strong enough, the spectrum follows a power-law distribution, as is typically the case for giant radio relics. Contrary to re-acceleration, compression only shifts the spectrum in the flux-frequency space without changing the underlying shape.
For our sources we found spatially non-uniform spectral indices. Together with the observed filamentary morphologies, this suggests a different degree of mixing of the relativistic particles from the AGNs with the ICM. This means that the compression scenario proposed by Enßlin & Gopal-Krishna (2001) does not explain all the aspects. The inhomogeneous mixing of relativistic particles with the ICM implies an averaging effective adiabatic index ((4/3) < γad < (5/3)) value, which consequently leads to different effective compression ratios across the source. Under these conditions and driven by a complex cluster dynamics, plasma instabilities may also play an important role in the re-acceleration of particles within the radio sources. These mechanisms cannot be modelled by existing numerical simulations. Recently, however, with the help of low-frequency (sub-GHz) observations, de Gasperin et al. (2017) showed the possibility of an interplay between fossil plasma and the perturbed ICM which can gently re-accelerate relativistic particles injected by AGNs of the galaxy cluster Abell 1033. If this kind of gentle re-acceleration mechanism is common for aged plasma in clusters of galaxies, it could provide a seed population of relativistic electrons and a possible connection between radio galaxies and re-acceleration mechanisms in radio halos or radio relics. An example of this scenario could be the Abell 3411−3412 galaxy cluster pair, where van Weeren et al. (2017) showed a morphological connection between a radio galaxy and a radio relic.
6. Conclusion
In this paper we studied three ultra-steep spectrum sources in galaxy clusters based on radio and X-ray observations. We found that these three sources (i) have complex filamentary radio morphology, (ii) show hints of curved spectra, and (iii) are probably related to AGN fossil radio plasma. Based on these properties, we conclude that these sources belong to the category of “radio phoenices”, as was defined by Kempner et al. (2004).
In this work we found that these three sources are located in galaxy clusters that are low mass (< 1015 M⊙) and have an un-relaxed dynamical state. This provides support for the scenario that phoenices are connected with shocks and/or ICM motions. In addition, we determined that these sources have spatially non-uniform spectral indices. This suggests a different degree of mixing of the relativistic particles from the AGNs with the ICM and implies that several mechanisms are operating for the re-energisation of the plasma.
With the advancement of low-frequency radio telescopes and data processing techniques, upcoming high-resolution and sensitive surveys at or below 150 MHz (such as LoTSS at 150 MHz; Shimwell et al. 2019, 6″, 100 μJy beam−1; LoLSS at 50 MHz; de Gasperin et al. in prep., 20″, 1.5 mJy beam−1) will be excellent tools for identifying many more revived fossil plasma sources in galaxy clusters, enabling statistical analysis of larger samples.
S ∝ να, where S is the measured flux density and ν is the observed frequency.
Acknowledgments
We thank the anonymous referee for useful comments. This paper is based (in part) on data obtained with the International LOFAR Telescope (ILT) under project code LC9_027 and LC6_015. LOFAR (van Haarlem et al. 2013) is the Low Frequency Array designed and constructed by ASTRON. It has observing, data processing, and data storage facilities in several countries, that are owned by various parties (each with their own funding sources), and that are collectively operated by the ILT foundation under a joint scientific policy. The ILT resources have benefitted from the following recent major funding sources: CNRS-INSU, Observatoire de Paris and Université d’Orléans, France; BMBF, MIWF-NRW, MPG, Germany; Science Foundation Ireland (SFI), Department of Business, Enterprise and Innovation (DBEI), Ireland; NWO, The Netherlands; The Science and Technology Facilities Council, UK; Ministry of Science and Higher Education, Poland; Istituto Nazionale di Astrofisica (INAF), Italy. We thank the staff of the GMRT that made these observations possible. GMRT is run by the National Centre for Radio Astrophysics of the Tata Institute of Fundamental Research. This paper is based on the data obtained with the International LOFAR Telescope (ILT). The Leiden LOFAR team acknowledge support from the ERC Advanced Investigator programme NewClusters 321271 and the VIDI research programme with project number 639.042.729, which is financed by the Netherlands Organisation for Scientific Research (NWO). MJH acknowledges support from STFC [ST/R000905/1]. This research made use of APLpy, an open-source plotting package for Python hosted at http://aplpy.github.com
References
- Akamatsu, H., & Kawahara, H. 2013, PASJ, 65, 16 [NASA ADS] [CrossRef] [Google Scholar]
- Arnaud, K. A. 1996, ASP Conf. Ser., 101, 17 [Google Scholar]
- Arnaud, M., Pointecouteau, E., & Pratt, G. W. 2005, A&A, 441, 893 [NASA ADS] [CrossRef] [EDP Sciences] [Google Scholar]
- Asplund, M., Grevesse, N., Sauval, A. J., & Scott, P. 2009, ARA&A, 47,481 [NASA ADS] [CrossRef] [Google Scholar]
- Bonafede, A., Brüggen, M., van Weeren, R., et al. 2012, MNRAS, 426, 40 [NASA ADS] [CrossRef] [Google Scholar]
- Botteon, A., Gastaldello, F., Brunetti, G., & Dallacasa, D. 2016, MNRAS, 460, L84 [NASA ADS] [CrossRef] [Google Scholar]
- Botteon, A., Brunetti, G., Ryu, D., & Roh, S. 2020, A&A, in press, https://doi.org/10.1051/0004-6361/201936216 [Google Scholar]
- Bourdin, H., Mazzotta, P., Markevitch, M., Giacintucci, S., & Brunetti, G. 2013, ApJ, 764, 82 [NASA ADS] [CrossRef] [Google Scholar]
- Brunetti, G., & Jones, T. W. 2014, Int. J. Mod. Phys. D, 23, 1430007 [Google Scholar]
- Brunetti, G., & Lazarian, A. 2007, MNRAS, 378, 245 [NASA ADS] [CrossRef] [Google Scholar]
- Brunetti, G., & Lazarian, A. 2011, MNRAS, 410, 127 [NASA ADS] [CrossRef] [Google Scholar]
- Brunetti, G., Setti, G., Feretti, L., & Giovannini, G. 2001, MNRAS, 320, 365 [NASA ADS] [CrossRef] [Google Scholar]
- Brunetti, G., Zimmer, S., & Zandanel, F. 2017, MNRAS, 472, 1506 [NASA ADS] [CrossRef] [Google Scholar]
- Cassano, R., Brunetti, G., Röttgering, H. J. A., & Brüggen, M. 2010, A&A, 509, A68 [NASA ADS] [CrossRef] [EDP Sciences] [Google Scholar]
- Chandra, P., Ray, A., & Bhatnagar, S. 2004, ApJ, 612, 974 [NASA ADS] [CrossRef] [Google Scholar]
- Clarke, T. E., Randall, S. W., Sarazin, C. L., Blanton, E. L., & Giacintucci, S. 2013, ApJ, 772, 84 [NASA ADS] [CrossRef] [Google Scholar]
- Cohen, A. S., Lane, W. M., Cotton, W. D., et al. 2007, AJ, 134, 1245 [NASA ADS] [CrossRef] [Google Scholar]
- Condon, J. J., Cotton, W. D., Greisen, E. W., et al. 1998, AJ, 115, 1693 [NASA ADS] [CrossRef] [Google Scholar]
- Cuciti, V., Cassano, R., Brunetti, G., et al. 2015, A&A, 580, A97 [NASA ADS] [CrossRef] [EDP Sciences] [Google Scholar]
- de Gasperin, F., Ogrean, G. A., van Weeren, R. J., et al. 2015, MNRAS, 448, 2197 [NASA ADS] [CrossRef] [Google Scholar]
- de Gasperin, F., Intema, H. T., Shimwell, T. W., et al. 2017, Sci. Adv., 3, e1701634 [NASA ADS] [CrossRef] [Google Scholar]
- de Gasperin, F., Dijkema, T. J., Drabent, A., et al. 2019, A&A, 622, A5 [NASA ADS] [CrossRef] [EDP Sciences] [Google Scholar]
- Dennison, B. 1980, ApJ, 239, L93 [NASA ADS] [CrossRef] [Google Scholar]
- Eckert, D., Jauzac, M., Vazza, F., et al. 2016, MNRAS, 461, 1302 [NASA ADS] [CrossRef] [Google Scholar]
- Enßlin, T. A., & Brüggen, M. 2002, MNRAS, 331, 1011 [NASA ADS] [CrossRef] [Google Scholar]
- Enßlin, T. A., & Gopal-Krishna 2001, A&A, 366, 26 [NASA ADS] [CrossRef] [EDP Sciences] [Google Scholar]
- Enßlin, T., Pfrommer, C., Miniati, F., & Subramanian, K. 2011, A&A, 527, A99 [NASA ADS] [CrossRef] [EDP Sciences] [Google Scholar]
- Feretti, L., Giovannini, G., Govoni, F., & Murgia, M. 2012, A&ARv, 20, 54 [Google Scholar]
- Finoguenov, A., Sarazin, C. L., Nakazawa, K., Wik, D. R., & Clarke, T. E. 2010, ApJ, 715, 1143 [NASA ADS] [CrossRef] [Google Scholar]
- Ghirardini, V., Eckert, D., Ettori, S., et al. 2019, A&A, 621, A41 [NASA ADS] [CrossRef] [EDP Sciences] [Google Scholar]
- Hardcastle, M. J., Gürkan, G., van Weeren, R. J., et al. 2016, MNRAS, 462, 1910 [NASA ADS] [CrossRef] [Google Scholar]
- Heald, G. H., Pizzo, R. F., Orrú, E., et al. 2015, A&A, 582, A123 [NASA ADS] [CrossRef] [EDP Sciences] [Google Scholar]
- Hurley-Walker, N., Callingham, J. R., Hancock, P. J., et al. 2017, MNRAS, 464, 1146 [NASA ADS] [CrossRef] [Google Scholar]
- Intema, H. T., van der Tol, S., Cotton, W. D., et al. 2009, A&A, 501, 1185 [NASA ADS] [CrossRef] [EDP Sciences] [Google Scholar]
- Intema, H. T., Jagannathan, P., Mooley, K. P., & Frail, D. A. 2017, A&A, 598, A78 [NASA ADS] [CrossRef] [EDP Sciences] [Google Scholar]
- Kalberla, P. M. W., Burton, W. B., Hartmann, D., et al. 2005, A&A, 440, 775 [NASA ADS] [CrossRef] [EDP Sciences] [Google Scholar]
- Kale, R., Venturi, T., Giacintucci, S., et al. 2015, A&A, 579, A92 [NASA ADS] [CrossRef] [EDP Sciences] [Google Scholar]
- Kang, H., & Ryu, D. 2015, ApJ, 809, 186 [NASA ADS] [CrossRef] [Google Scholar]
- Kempner, J. C., Blanton, E. L., Clarke, T. E., et al. 2004, in The Riddle of Cooling Flows in Galaxies and Clusters of Galaxies, eds. T. Reiprich, J. Kempner, & N. Soker, 335 [Google Scholar]
- Kierdorf, M., Beck, R., Hoeft, M., et al. 2017, A&A, 600, A18 [NASA ADS] [CrossRef] [EDP Sciences] [Google Scholar]
- Kravtsov, A. V., & Borgani, S. 2012, ARA&A, 50, 353 [NASA ADS] [CrossRef] [Google Scholar]
- Lane, W. M., Cotton, W. D., Helmboldt, J. F., & Kassim, N. E. 2012, Radio Sci., 47, RS0K04 [CrossRef] [Google Scholar]
- Lane, W. M., Cotton, W. D., van Velzen, S., et al. 2014, MNRAS, 440, 327 [NASA ADS] [CrossRef] [Google Scholar]
- Liu, A., Tozzi, P., Yu, H., De Grandi, S., & Ettori, S. 2018, MNRAS, 481, 361 [NASA ADS] [CrossRef] [Google Scholar]
- Mandal, S., Intema, H. T., Shimwell, T. W., et al. 2019, A&A, 622, A22 [NASA ADS] [CrossRef] [EDP Sciences] [Google Scholar]
- Markevitch, M., & Vikhlinin, A. 2007, Phys. Rep., 443, 1 [NASA ADS] [CrossRef] [EDP Sciences] [Google Scholar]
- Mechev, A. P., Plaat, A., Oonk, J. B. R., Intema, H. T., & Röttgering, H. J. A. 2018, Astron. Comput., 24, 117 [NASA ADS] [CrossRef] [Google Scholar]
- Mernier, F., Werner, N., Bagchi, J., et al. 2019, MNRAS, 486, 5430 [NASA ADS] [CrossRef] [Google Scholar]
- Nolting, C., Jones, T. W., O’Neill, B. J., & Mendygral, P. J. 2019, ApJ, 876, 154 [NASA ADS] [CrossRef] [Google Scholar]
- Petrosian, V. 2001, ApJ, 557, 560 [NASA ADS] [CrossRef] [Google Scholar]
- Pinzke, A., Oh, S. P., & Pfrommer, C. 2017, MNRAS, 465, 4800 [NASA ADS] [CrossRef] [Google Scholar]
- Scaife, A. M. M., & Heald, G. H. 2012, MNRAS, 423, L30 [NASA ADS] [CrossRef] [Google Scholar]
- Shimwell, T. W., Markevitch, M., Brown, S., et al. 2015, MNRAS, 449, 1486 [NASA ADS] [CrossRef] [Google Scholar]
- Shimwell, T. W., Röttgering, H. J. A., Best, P. N., et al. 2017, A&A, 598, A104 [NASA ADS] [CrossRef] [EDP Sciences] [Google Scholar]
- Shimwell, T. W., Tasse, C., Hardcastle, M. J., et al. 2019, A&A, 622, A1 [NASA ADS] [CrossRef] [EDP Sciences] [Google Scholar]
- Simard, L., Clowe, D., Desai, V., et al. 2009, A&A, 508, 1141 [NASA ADS] [CrossRef] [EDP Sciences] [Google Scholar]
- Slee, O. B., Roy, A. L., Murgia, M., Andernach, H., & Ehle, M. 2001, AJ, 122, 1172 [NASA ADS] [CrossRef] [Google Scholar]
- Smirnov, O. M., & Tasse, C. 2015, MNRAS, 449, 2668 [NASA ADS] [CrossRef] [Google Scholar]
- Stroe, A., van Weeren, R. J., Intema, H. T., et al. 2013, A&A, 555, A110 [NASA ADS] [CrossRef] [EDP Sciences] [Google Scholar]
- Struble, M. F., & Rood, H. J. 1999, ApJS, 125, 35 [NASA ADS] [CrossRef] [Google Scholar]
- Tasse, C. 2014, ArXiv e-prints [arXiv:1410.8706] [Google Scholar]
- Tasse, C., Hugo, B., Mirmont, M., et al. 2018, A&A, 611, A87 [NASA ADS] [CrossRef] [EDP Sciences] [Google Scholar]
- Ulmer, M. P., Kowalski, M. P., Cruddace, R. G., et al. 1981, ApJ, 243, 681 [NASA ADS] [CrossRef] [Google Scholar]
- Urdampilleta, I., Akamatsu, H., Mernier, F., et al. 2018, A&A, 618, A74 [NASA ADS] [CrossRef] [EDP Sciences] [Google Scholar]
- van Haarlem, M. P., Wise, M. W., Gunst, A. W., et al. 2013, A&A, 556, A2 [NASA ADS] [CrossRef] [EDP Sciences] [Google Scholar]
- van Weeren, R. J., Röttgering, H. J. A., Brüggen, M., & Cohen, A. 2009, A&A, 508, 75 [NASA ADS] [CrossRef] [EDP Sciences] [Google Scholar]
- van Weeren, R. J., Röttgering, H. J. A., Brüggen, M., & Hoeft, M. 2010, Science, 330, 347 [NASA ADS] [CrossRef] [PubMed] [Google Scholar]
- van Weeren, R. J., Röttgering, H. J. A., & Brüggen, M. 2011, A&A, 527, A114 [NASA ADS] [CrossRef] [EDP Sciences] [Google Scholar]
- van Weeren, R. J., Brunetti, G., Brüggen, M., et al. 2016a, ApJ, 818, 204 [NASA ADS] [CrossRef] [Google Scholar]
- van Weeren, R. J., Williams, W. L., Hardcastle, M. J., et al. 2016b, ApJS, 223, 2 [NASA ADS] [CrossRef] [Google Scholar]
- van Weeren, R. J., Andrade-Santos, F., Dawson, W. A., et al. 2017, Nat. Astron., 1, 0005 [NASA ADS] [CrossRef] [Google Scholar]
- van Weeren, R. J., de Gasperin, F., Akamatsu, H., et al. 2019, Space Sci. Rev., 215, 16 [NASA ADS] [CrossRef] [Google Scholar]
- Voges, W., Aschenbach, B., Boller, T., et al. 1999, A&A, 349, 389 [NASA ADS] [Google Scholar]
- Wayth, R. B., Lenc, E., Bell, M. E., et al. 2015, PASA, 32, e025 [NASA ADS] [CrossRef] [Google Scholar]
- Wen, Z. L., Han, J. L., & Liu, F. S. 2012, ApJS, 199, 34 [NASA ADS] [CrossRef] [Google Scholar]
- Williams, W. L., van Weeren, R. J., Röttgering, H. J. A., et al. 2016, MNRAS, 460, 2385 [NASA ADS] [CrossRef] [Google Scholar]
- Yang, X., Mo, H. J., van den Bosch, F. C., et al. 2007, ApJ, 671, 153 [NASA ADS] [CrossRef] [Google Scholar]
Appendix A: Spectral index error map
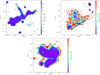 |
Fig. A.1. Spectral index error maps of Abell 2593, SDSS-C4-DR3-3088, and Abell 2048. The overplotted contours are the same as in the LOFAR 150 MHz images for each sources. |
Appendix B: Additional spectral index and error maps of SDSS-C4-DR3-3088
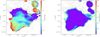 |
Fig. B.1. Low-resolution (22″) spectral index and error maps of SDSS-C4-DR3-3088. |
All Tables
Target list of three TGSS clusters with their properties, as given in the literature.
Observation details (on-source time) of Abell 2593, SDSS-C4-DR3-3088 and Abell 2048.
Imaging parameters and image properties of the LOFAR and GMRT maps of Abell 2593, SDSS-C4-DR3-3088, and Abell 2048.
All Figures
|
Fig. 1. Top left panel: full-resolution LOFAR image contours (white; as shown in the right panel) of Abell 2593, overlaid on an exposure-corrected Chandra image in the 0.5−2.0 keV energy band with a total integration time of 7 ks. Top right panel: 150 MHz LOFAR image (9″ × 6″). The black contours and dashed lines show the (1,2,4,...) × 5 × σLOFAR150 and −3 × σLOFAR150 levels, respectively, where σLOFAR150 = 219 μJy beam−1. Middle left panel: 325 MHz GMRT image (11″ × 7″). The black contours and dashed lines show the (1,2,4,...) × 5 × σGMRT325 and −3 × σGMRT325 levels, respectively, where σGMRT325 = 66 μJy beam−1. Middle right panel: 610 MHz GMRT image (5″ × 4″). The black contours and dashed lines show the (1,2,4,...) × 5 × σGMRT610 and −3 × σGMRT610 levels, respectively, where σGMRT610 = 38 μJy beam−1. Bottom left panel: LOFAR 150 MHz contours (shown in the top left panel) in red overlaid on an SDSS r-band image of Abell 2593. The labelled galaxies (RG1-A and RG2-A) are the possible counterparts for the radio emission of regions A and C. The BCG label indicates the brightest cluster galaxy. Bottom right panel: LOFAR 150 MHz contours (shown in the top right panel) overplotted on the high-resolution (20″ × 20″) spectral index map of Abell 2593. |
| In the text | |
|
Fig. 2. Top left panel: full-resolution LOFAR image contours (white; as shown in the right panel) of SDSS-C4-DR3-3088, overlaid on an exposure-corrected Chandra image in the 0.5−2.0 keV energy band with a total integration time of 17 ks. Top right panel: 150 MHz LOFAR image of SDSS-C4-DR3-3088 (6″ × 6″). The black contours and dashed lines show the (1,2,4,...) × 5 × σLOFAR150 and −3 × σLOFAR150 levels, respectively, where σLOFAR150 = 80 μJy beam−1. Middle left panel: 325 MHz GMRT image (13″ × 7″). The black contours and dashed lines show the (1,2,4,...) × 5 × σGMRT325 and −3 × σGMRT325 levels, respectively, where σGMRT325 = 43 μJy beam−1. Middle right panel: 610 MHz GMRT image (6″ × 4″). The black contours and dashed lines show the (1,2,4,...) × 5 × σGMRT610 and −3 × σGMRT610 levels, respectively, where σGMRT610 = 40 μJy beam−1. Bottom left panel: LOFAR 150 MHz contours (shown in left panel in red) overlaid on an SDSS r-band image of SDSS-C4-DR3-3088. A possible optical counterpart is labelled RG-A. Bottom right panel: LOFAR 150 MHz contours (shown in the top right panel) overplotted on the high-resolution (7″ × 7″) spectral index map of SDSS-C4-DR3-3088. |
| In the text | |
|
Fig. 3. Top left panel: full-resolution LOFAR image contours (white; shown in the top right panel) of Abell 2048, overlaid on an exposure-corrected background-subtracted XMM-Newton image in the 0.5−2.0 keV energy band with a total integration time of 68 ks. Top right panel: 150 MHz LOFAR image (13″ × 6″) of the source Abell 2048. The black contours and dashed lines show the (1,2,4,...) × 5 × σLOFAR150 and −3 × σLOFAR150 levels, respectively, where σLOFAR150 = 266 μJy beam−1. Middle left panel: 325 MHz GMRT image (11″ × 8″) of Abell 2048. The black contours and dashed lines show the (1,2,4,...) × 5 × σGMRT325 and −3 × σGMRT325 levels, respectively, where σGMRT325 = 125 μJy beam−1. Middle right panel: 610 MHz GMRT image (8″ × 5″) of Abell 2048. The black contours and dashed lines show the (1,2,4,...) ×5 × σGMRT610 and −3 × σGMRT610 levels, respectively, where σGMRT610 = 117 μJy beam−1. Bottom left panel: LOFAR 150 MHz contours (shown in the left panel in red) overlaid on an DSS2 r-band image of Abell 2048. A possible optical counterpart is labelled RG. Bottom right panel: LOFAR 150 MHz contours (shown in the top right panel) overplotted on the high-resolution (20″ × 20″) spectral index map of Abell 2048. |
| In the text | |
|
Fig. A.1. Spectral index error maps of Abell 2593, SDSS-C4-DR3-3088, and Abell 2048. The overplotted contours are the same as in the LOFAR 150 MHz images for each sources. |
| In the text | |
|
Fig. B.1. Low-resolution (22″) spectral index and error maps of SDSS-C4-DR3-3088. |
| In the text | |
Current usage metrics show cumulative count of Article Views (full-text article views including HTML views, PDF and ePub downloads, according to the available data) and Abstracts Views on Vision4Press platform.
Data correspond to usage on the plateform after 2015. The current usage metrics is available 48-96 hours after online publication and is updated daily on week days.
Initial download of the metrics may take a while.