Fig. 3.
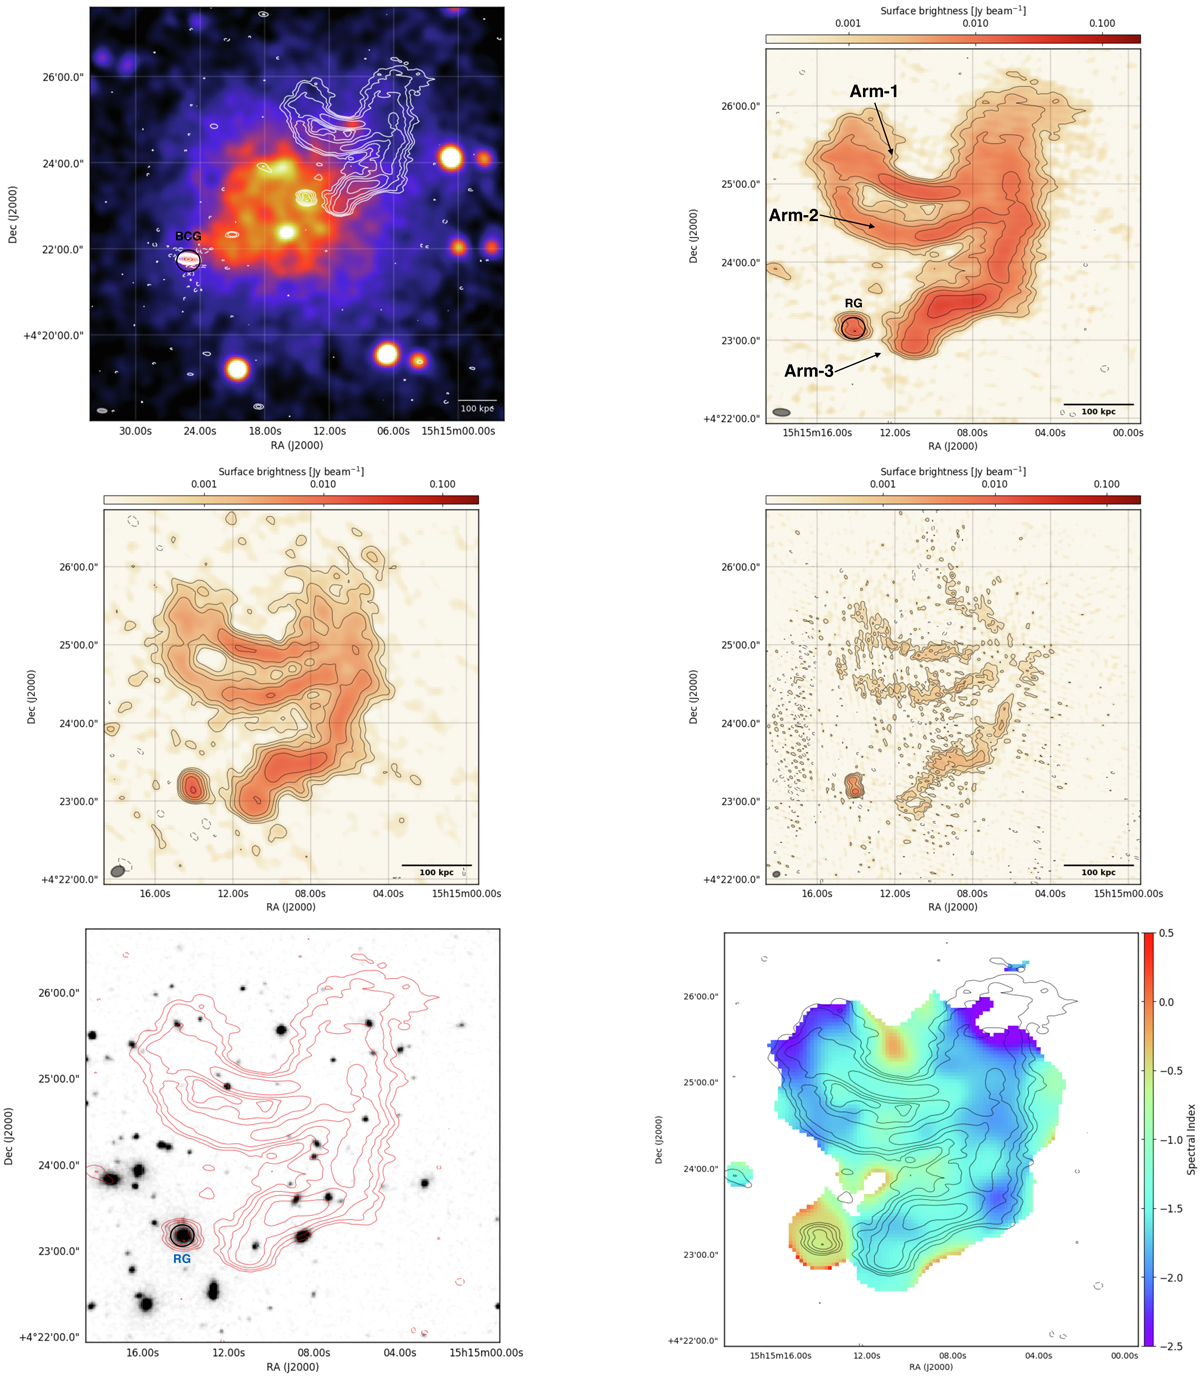
Top left panel: full-resolution LOFAR image contours (white; shown in the top right panel) of Abell 2048, overlaid on an exposure-corrected background-subtracted XMM-Newton image in the 0.5−2.0 keV energy band with a total integration time of 68 ks. Top right panel: 150 MHz LOFAR image (13″ × 6″) of the source Abell 2048. The black contours and dashed lines show the (1,2,4,...) × 5 × σLOFAR150 and −3 × σLOFAR150 levels, respectively, where σLOFAR150 = 266 μJy beam−1. Middle left panel: 325 MHz GMRT image (11″ × 8″) of Abell 2048. The black contours and dashed lines show the (1,2,4,...) × 5 × σGMRT325 and −3 × σGMRT325 levels, respectively, where σGMRT325 = 125 μJy beam−1. Middle right panel: 610 MHz GMRT image (8″ × 5″) of Abell 2048. The black contours and dashed lines show the (1,2,4,...) ×5 × σGMRT610 and −3 × σGMRT610 levels, respectively, where σGMRT610 = 117 μJy beam−1. Bottom left panel: LOFAR 150 MHz contours (shown in the left panel in red) overlaid on an DSS2 r-band image of Abell 2048. A possible optical counterpart is labelled RG. Bottom right panel: LOFAR 150 MHz contours (shown in the top right panel) overplotted on the high-resolution (20″ × 20″) spectral index map of Abell 2048.
Current usage metrics show cumulative count of Article Views (full-text article views including HTML views, PDF and ePub downloads, according to the available data) and Abstracts Views on Vision4Press platform.
Data correspond to usage on the plateform after 2015. The current usage metrics is available 48-96 hours after online publication and is updated daily on week days.
Initial download of the metrics may take a while.