Fig. 8.
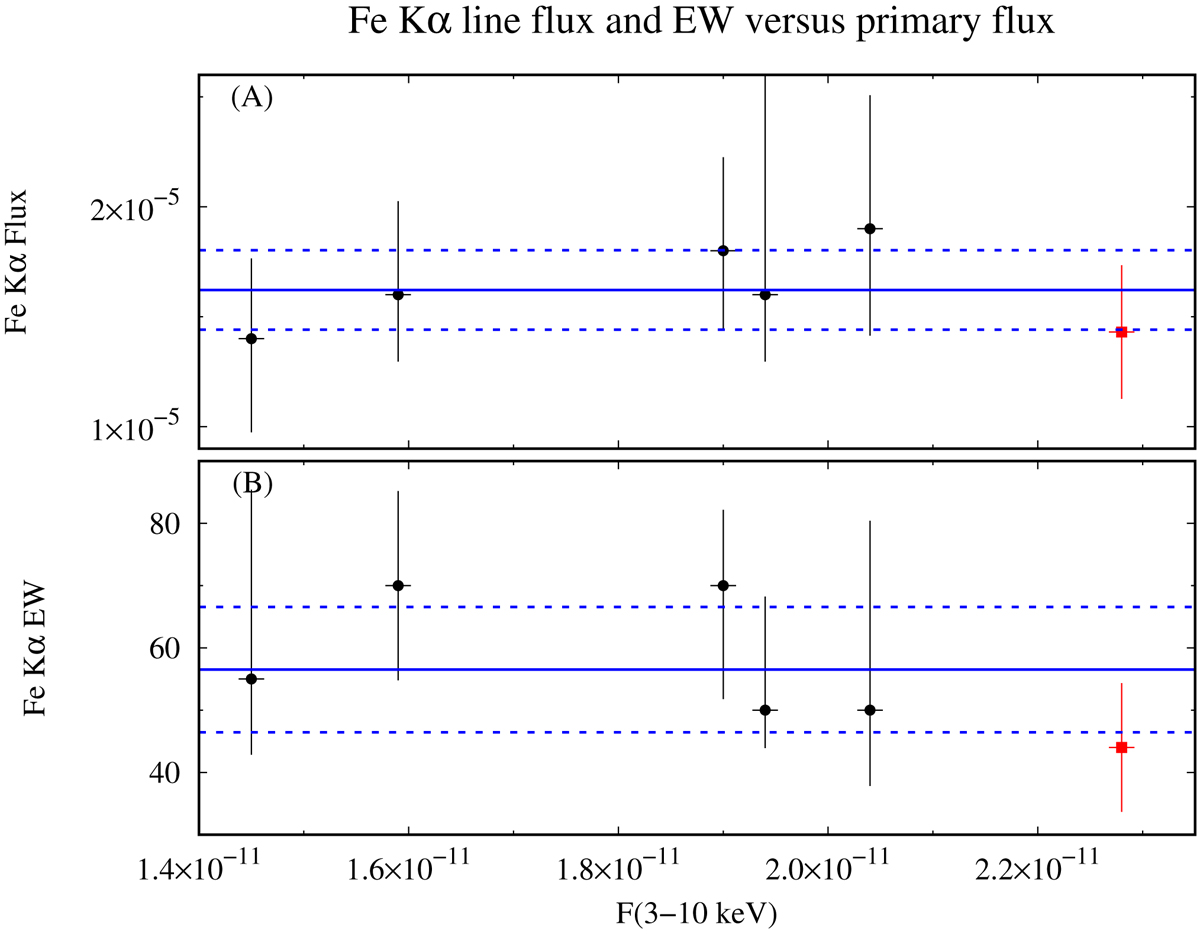
Parameters of the Fe Kα line plotted against the primary flux in the 3–10 keV band. The red square corresponds to the 2004 XMM–Newton observation. Panel A: line flux in units of photons cm−2 s−1. Panel B: line equivalent width in units of eV. Error bars denote the 1σ uncertainty. The blue solid lines represent the mean value for each parameter during the campaign, while the blue dashed lines represent the standard deviation.
Current usage metrics show cumulative count of Article Views (full-text article views including HTML views, PDF and ePub downloads, according to the available data) and Abstracts Views on Vision4Press platform.
Data correspond to usage on the plateform after 2015. The current usage metrics is available 48-96 hours after online publication and is updated daily on week days.
Initial download of the metrics may take a while.