Open Access
Fig. 5.
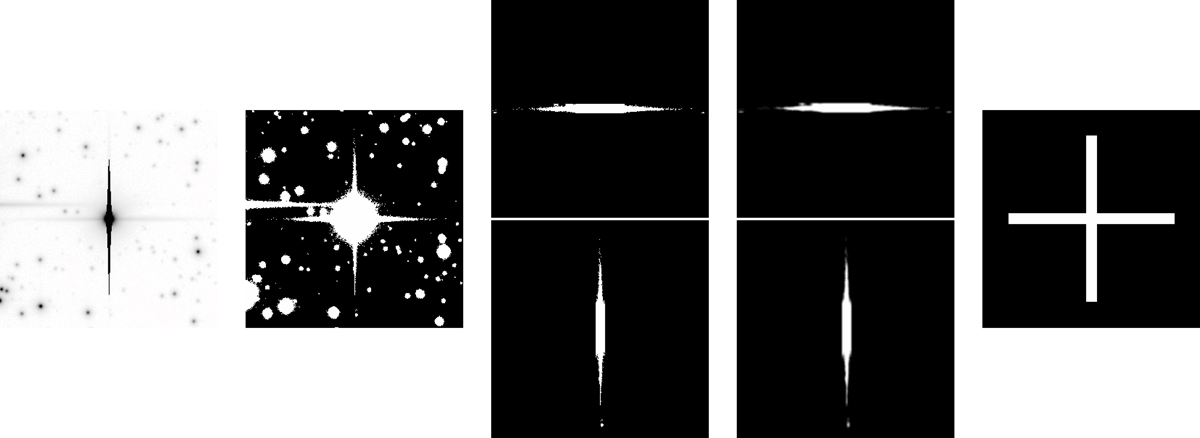
Empirical spike flagging process. From left to right: source image centered on a bright star candidate, the same image thresholded, the two pointwise products, the matched filtered pointwise products, the final mask drawed from the empirical size computed with the two previous masks.
Current usage metrics show cumulative count of Article Views (full-text article views including HTML views, PDF and ePub downloads, according to the available data) and Abstracts Views on Vision4Press platform.
Data correspond to usage on the plateform after 2015. The current usage metrics is available 48-96 hours after online publication and is updated daily on week days.
Initial download of the metrics may take a while.