Open Access
Fig. A.2.
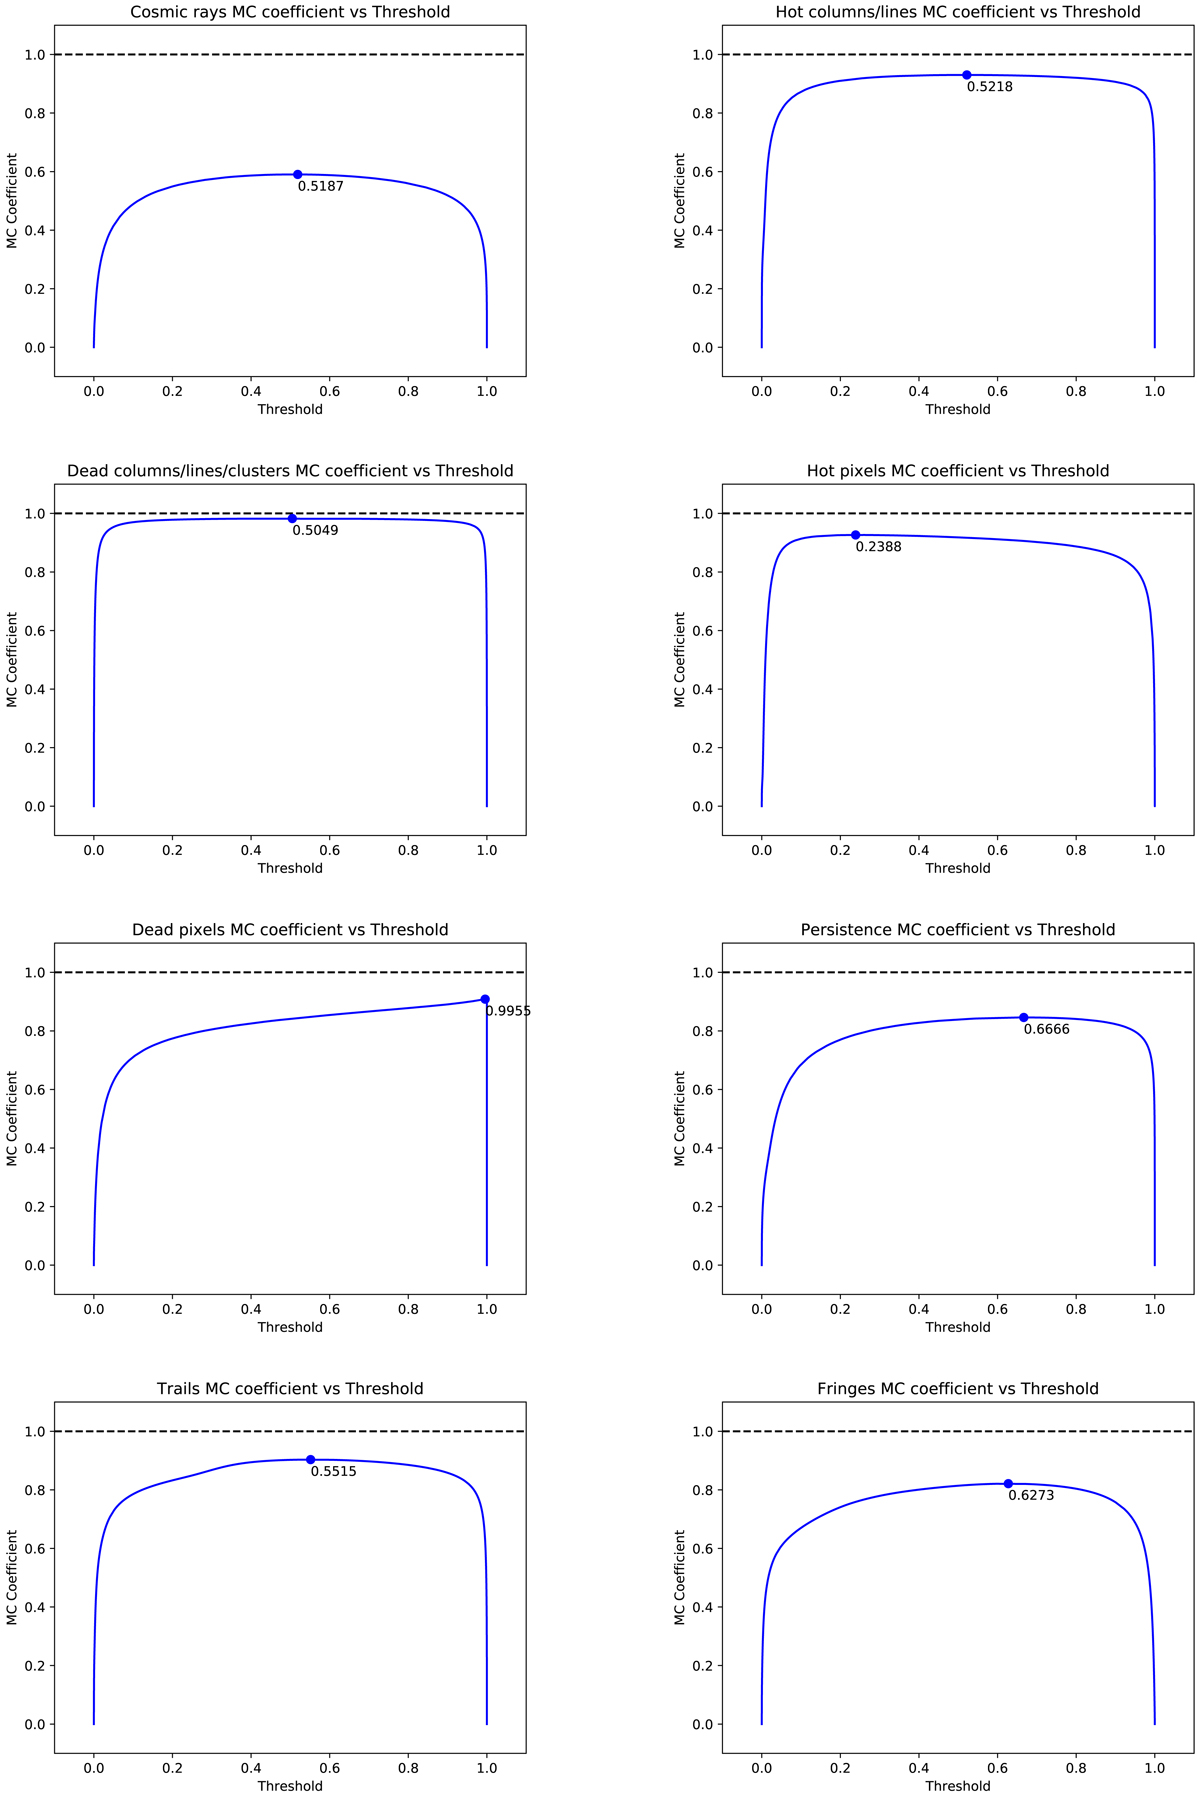
MC coefficient curves: MC coefficient vs. detection threshold. On each curve is annotated the threshold for which the MC coefficient is the highest. These curves were computed using the probabilities corrected from priors using empirical training priors.
Current usage metrics show cumulative count of Article Views (full-text article views including HTML views, PDF and ePub downloads, according to the available data) and Abstracts Views on Vision4Press platform.
Data correspond to usage on the plateform after 2015. The current usage metrics is available 48-96 hours after online publication and is updated daily on week days.
Initial download of the metrics may take a while.