Fig. 12.
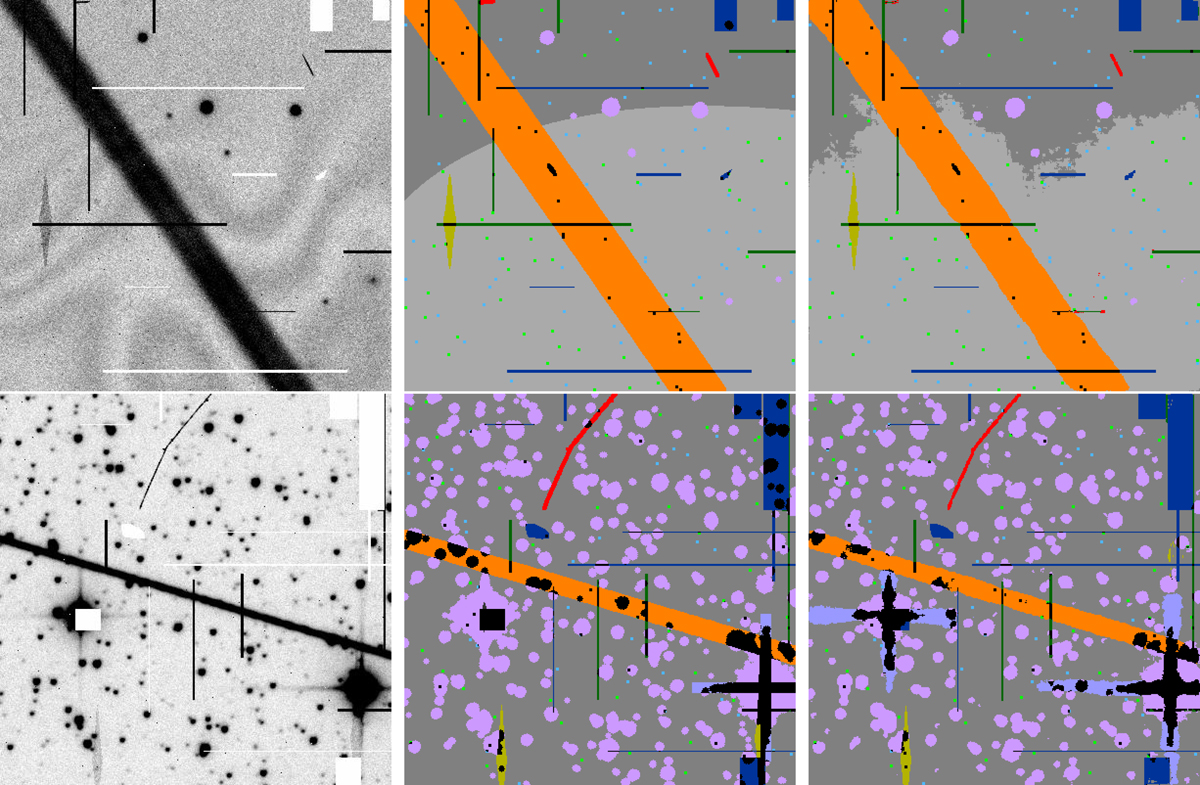
Examples of qualitative results on test data. Left: input; middle: ground truth; right: predictions. Each class is assigned a color so that the ground truth can be represented in one single image. Class predictions are done according to the threshold giving the highest MC coefficient. The color coding is identical to that of Fig. 8.
Current usage metrics show cumulative count of Article Views (full-text article views including HTML views, PDF and ePub downloads, according to the available data) and Abstracts Views on Vision4Press platform.
Data correspond to usage on the plateform after 2015. The current usage metrics is available 48-96 hours after online publication and is updated daily on week days.
Initial download of the metrics may take a while.