Fig. 9.
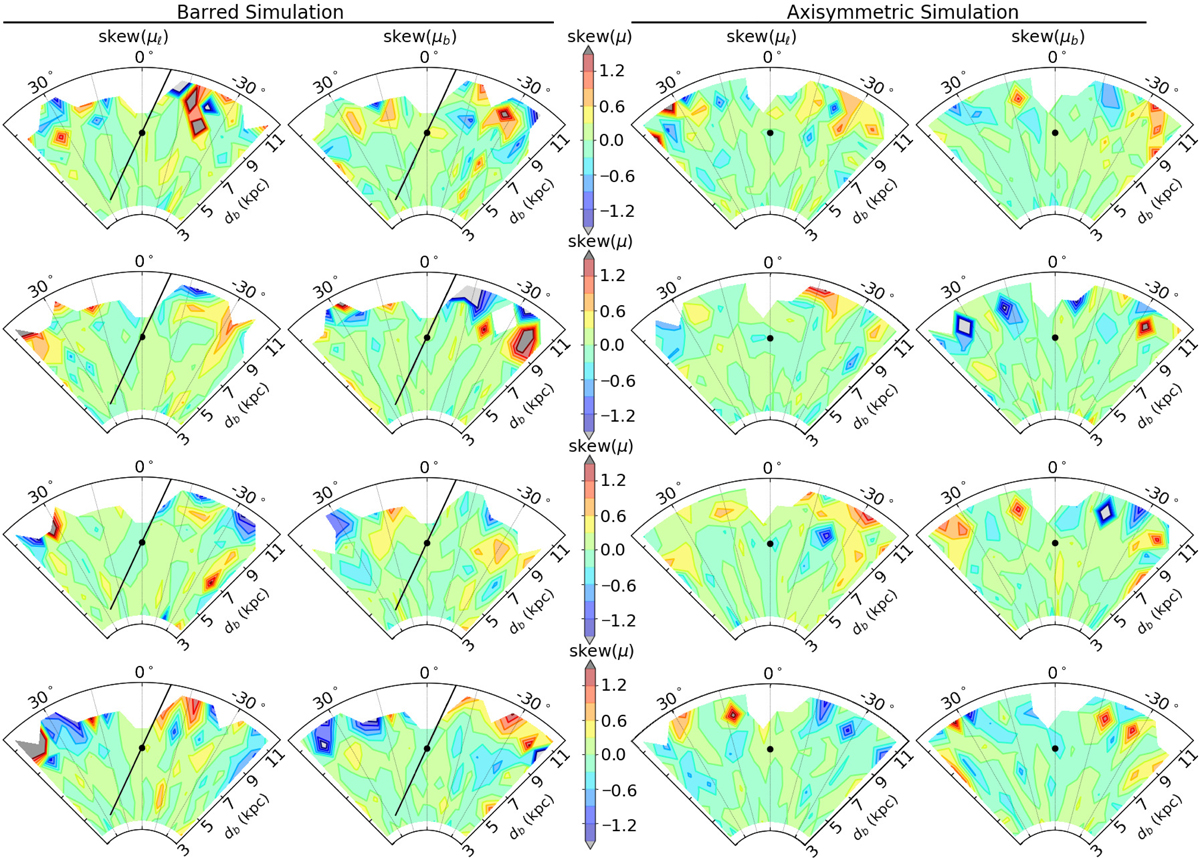
Maps of skew (μb) for eight different subsamplings of the models with the same spatial distribution as the Gaia DR225 subset. The first and second columns correspond to the barred simulation while the two last columns show the maps expected for the axisymmetric model. The number of observing months is set to n = 22 and the maximum relative parallax error is f = 0.25.
Current usage metrics show cumulative count of Article Views (full-text article views including HTML views, PDF and ePub downloads, according to the available data) and Abstracts Views on Vision4Press platform.
Data correspond to usage on the plateform after 2015. The current usage metrics is available 48-96 hours after online publication and is updated daily on week days.
Initial download of the metrics may take a while.