Fig. 8.
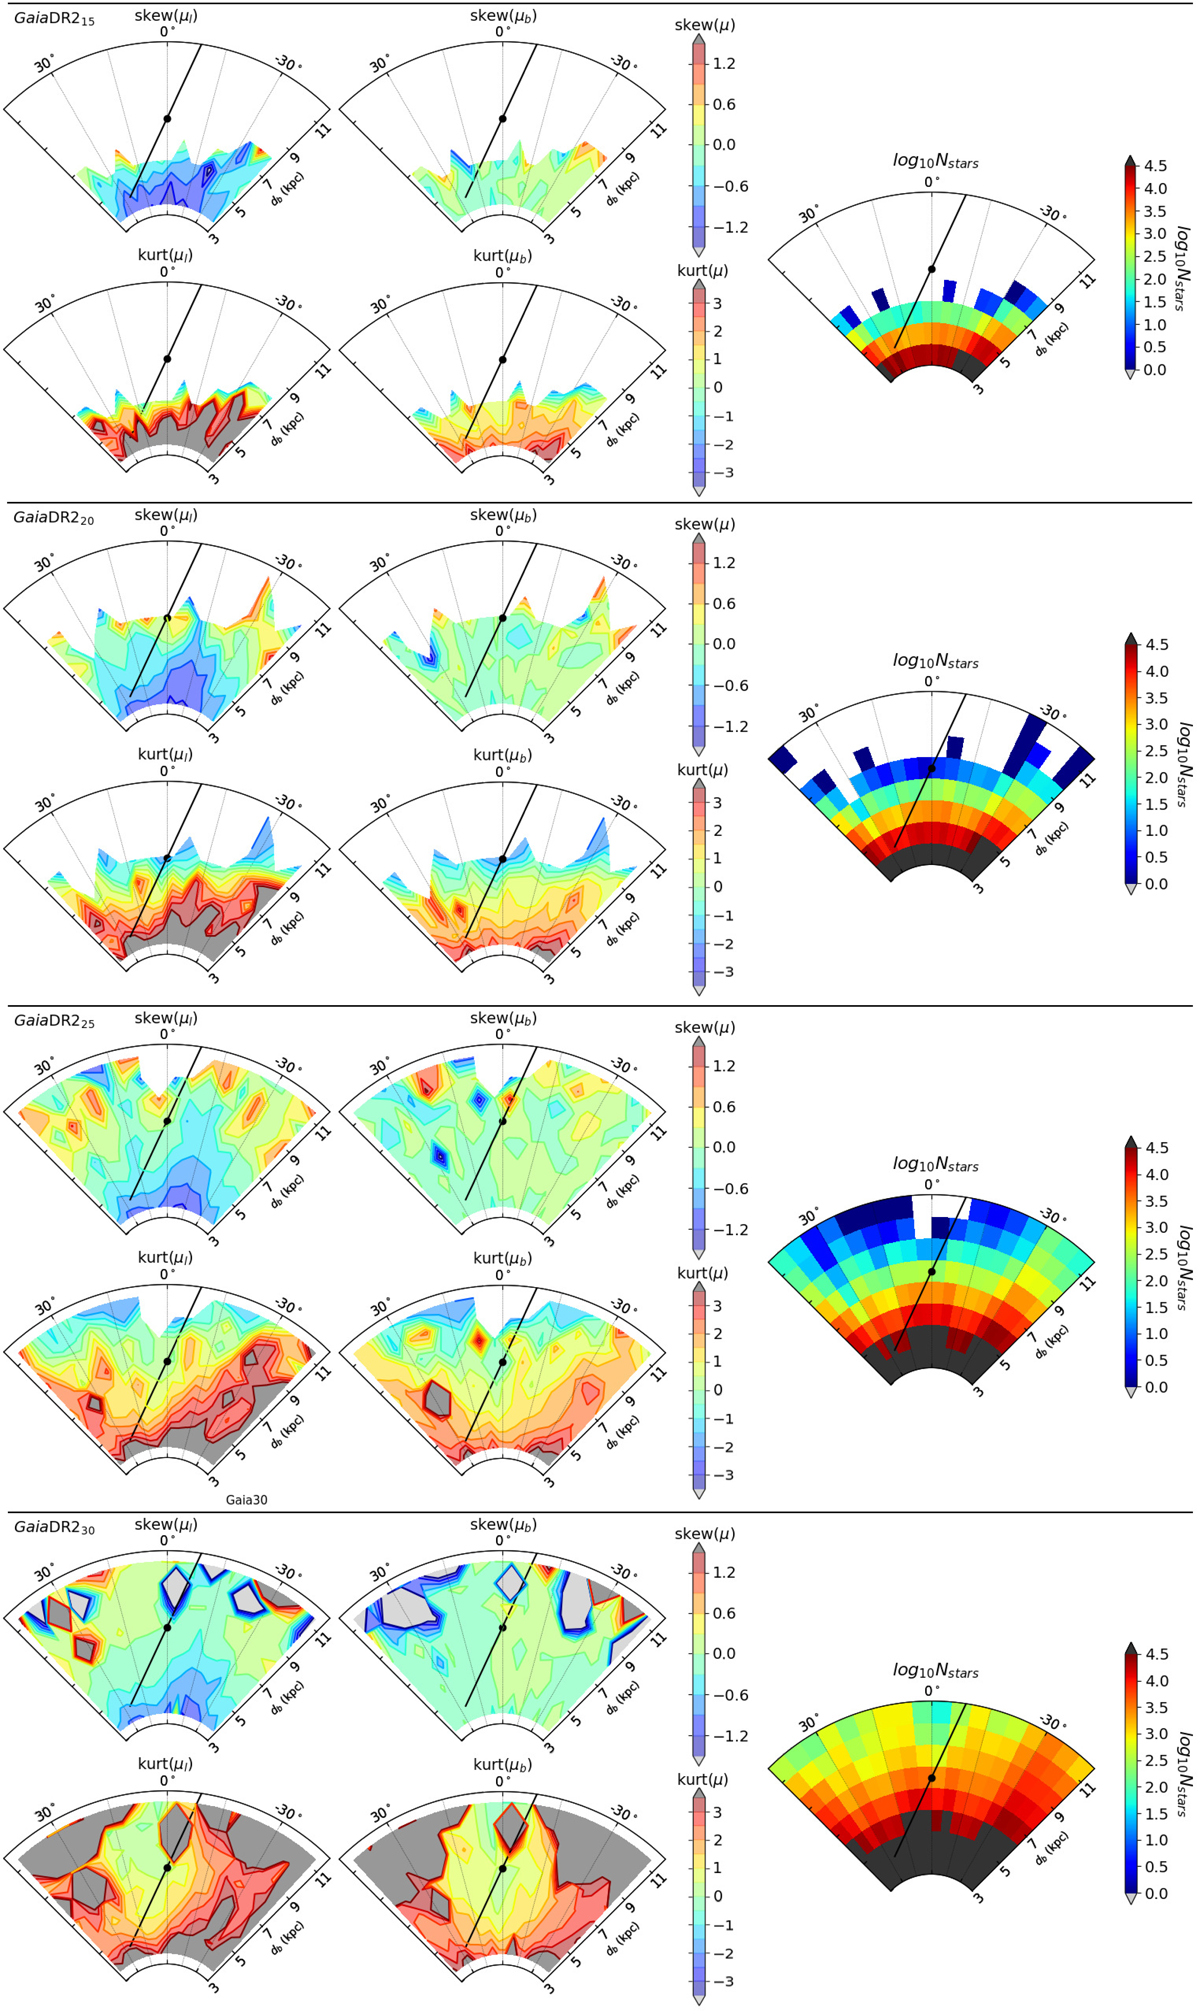
Maps of the skewness (odd rows) and kurtosis (even rows) of the observed longitudinal (first column) and latitudinal (second column) proper motions of Gaia DR2. The number of sources per bin is shown in the third column. Each block corresponds, from top to bottom, to the f = σϖ/ϖ cutoff of 0.15, 0.20, 0.25, and 0.30. The Galactic centre and the bar are denoted by the black spot at db = R0 and the solid line, respectively. The half-length and orientation angle of the bar are set to 4.5 kpc and 25°, respectively.
Current usage metrics show cumulative count of Article Views (full-text article views including HTML views, PDF and ePub downloads, according to the available data) and Abstracts Views on Vision4Press platform.
Data correspond to usage on the plateform after 2015. The current usage metrics is available 48-96 hours after online publication and is updated daily on week days.
Initial download of the metrics may take a while.