Fig. 7.
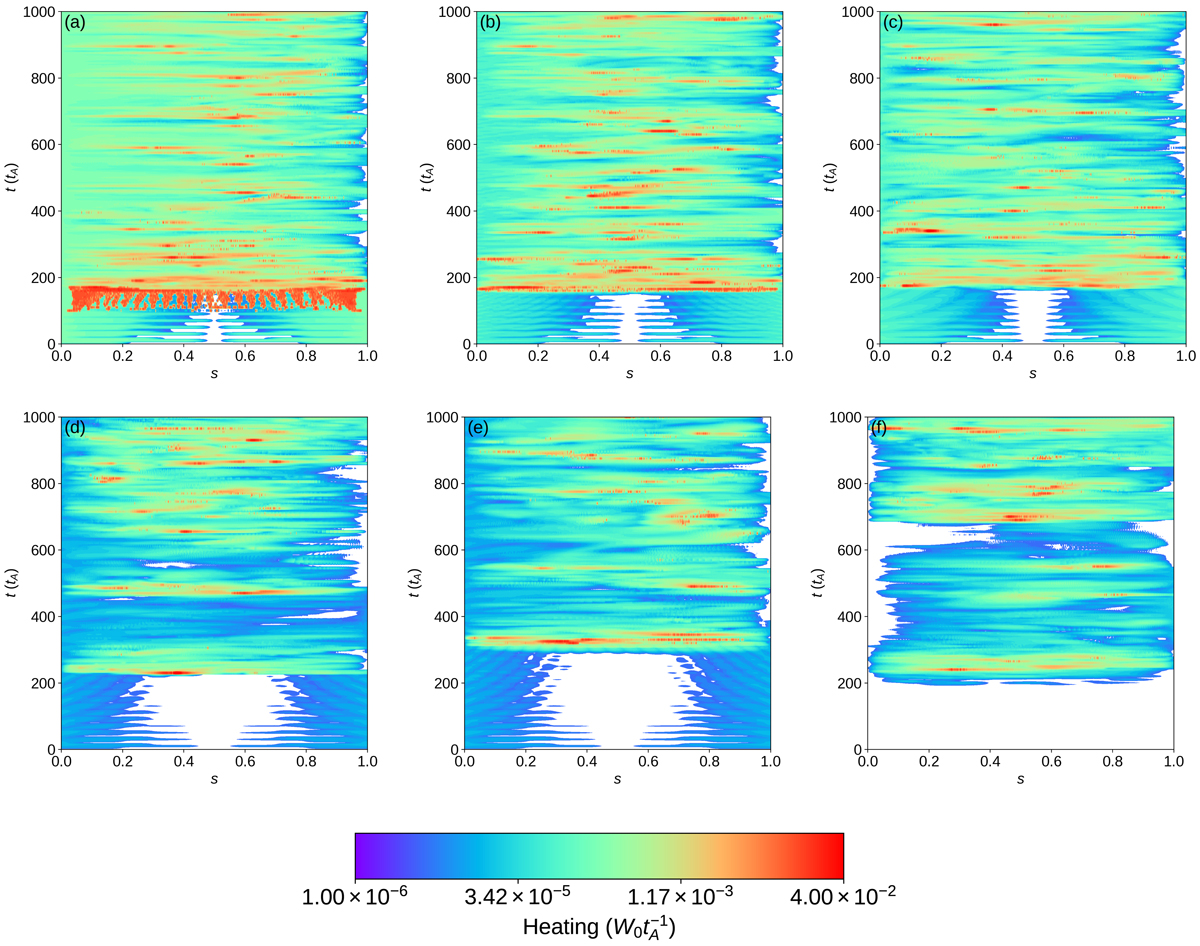
Contours of heating as a function of time along the six field lines shown in Fig. 6. Field lines (a)–(c) are in the upper row, and (d)–(f) in the lower. The horizontal axis shows distance along the field line, normalized to the interval [0.0,1.0], the vertical axis shows time, and the contours are scaled logarithmically across four orders of magnitude. The location on the boundary from which each field line is traced is advected in time by the driving velocity, such that the same field line is theoretically tracked over time.
Current usage metrics show cumulative count of Article Views (full-text article views including HTML views, PDF and ePub downloads, according to the available data) and Abstracts Views on Vision4Press platform.
Data correspond to usage on the plateform after 2015. The current usage metrics is available 48-96 hours after online publication and is updated daily on week days.
Initial download of the metrics may take a while.