Free Access
Fig. 6.
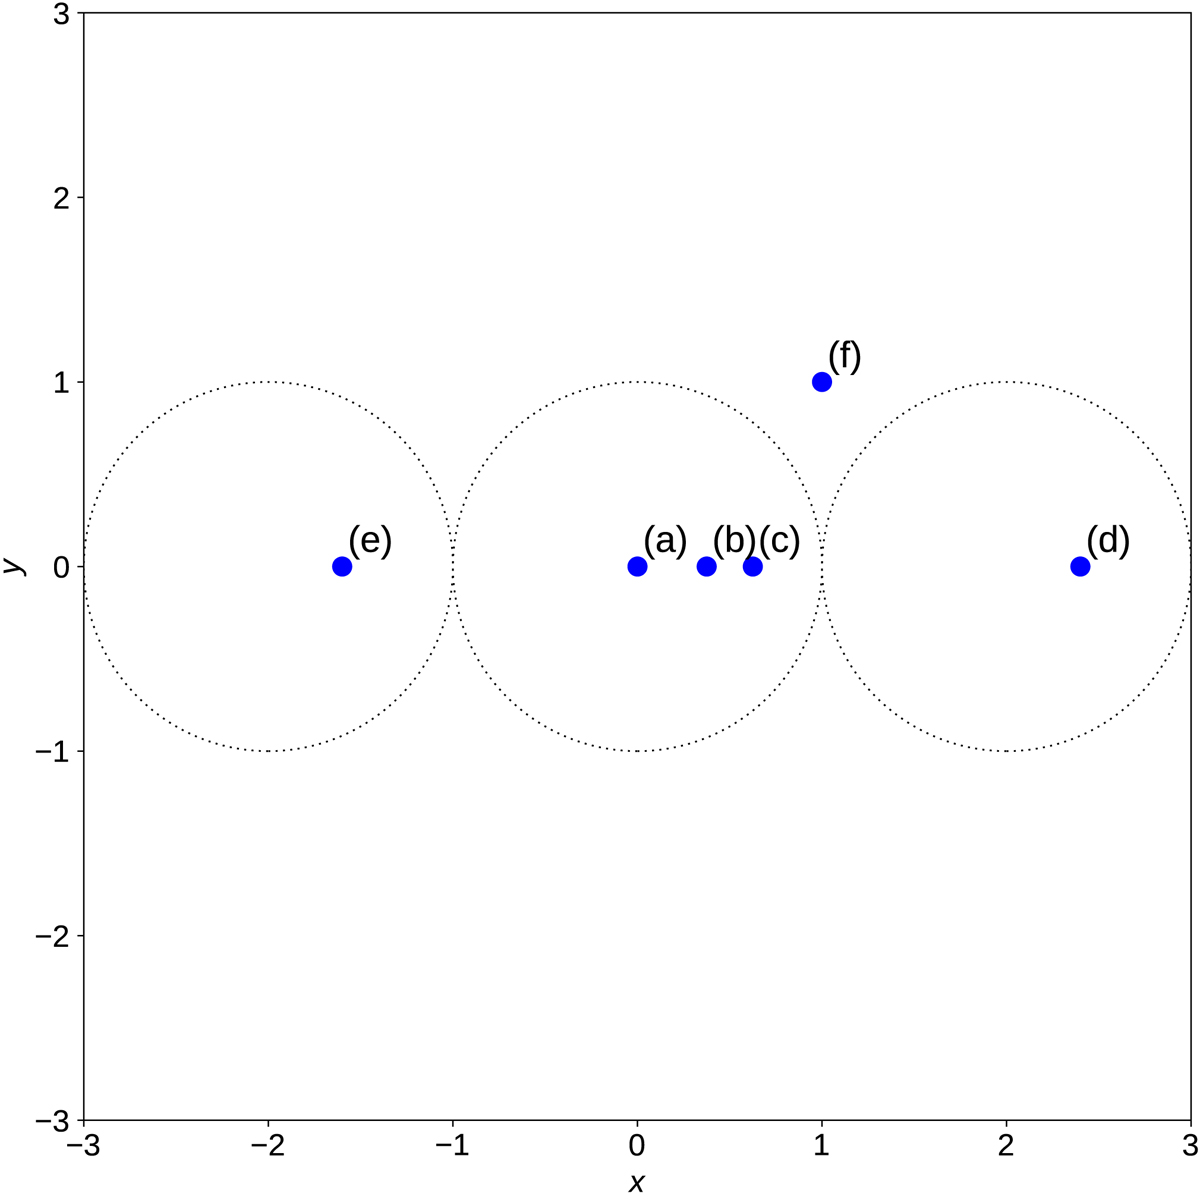
Distribution, at t = 0 and on z = −10, of the six field lines that are tracked from the lower boundary, along which the heating is calculated in subsequent figures. The dotted circles represent the initial location of the three threads, and the domain in which they are driven.
Current usage metrics show cumulative count of Article Views (full-text article views including HTML views, PDF and ePub downloads, according to the available data) and Abstracts Views on Vision4Press platform.
Data correspond to usage on the plateform after 2015. The current usage metrics is available 48-96 hours after online publication and is updated daily on week days.
Initial download of the metrics may take a while.