Fig. 12.
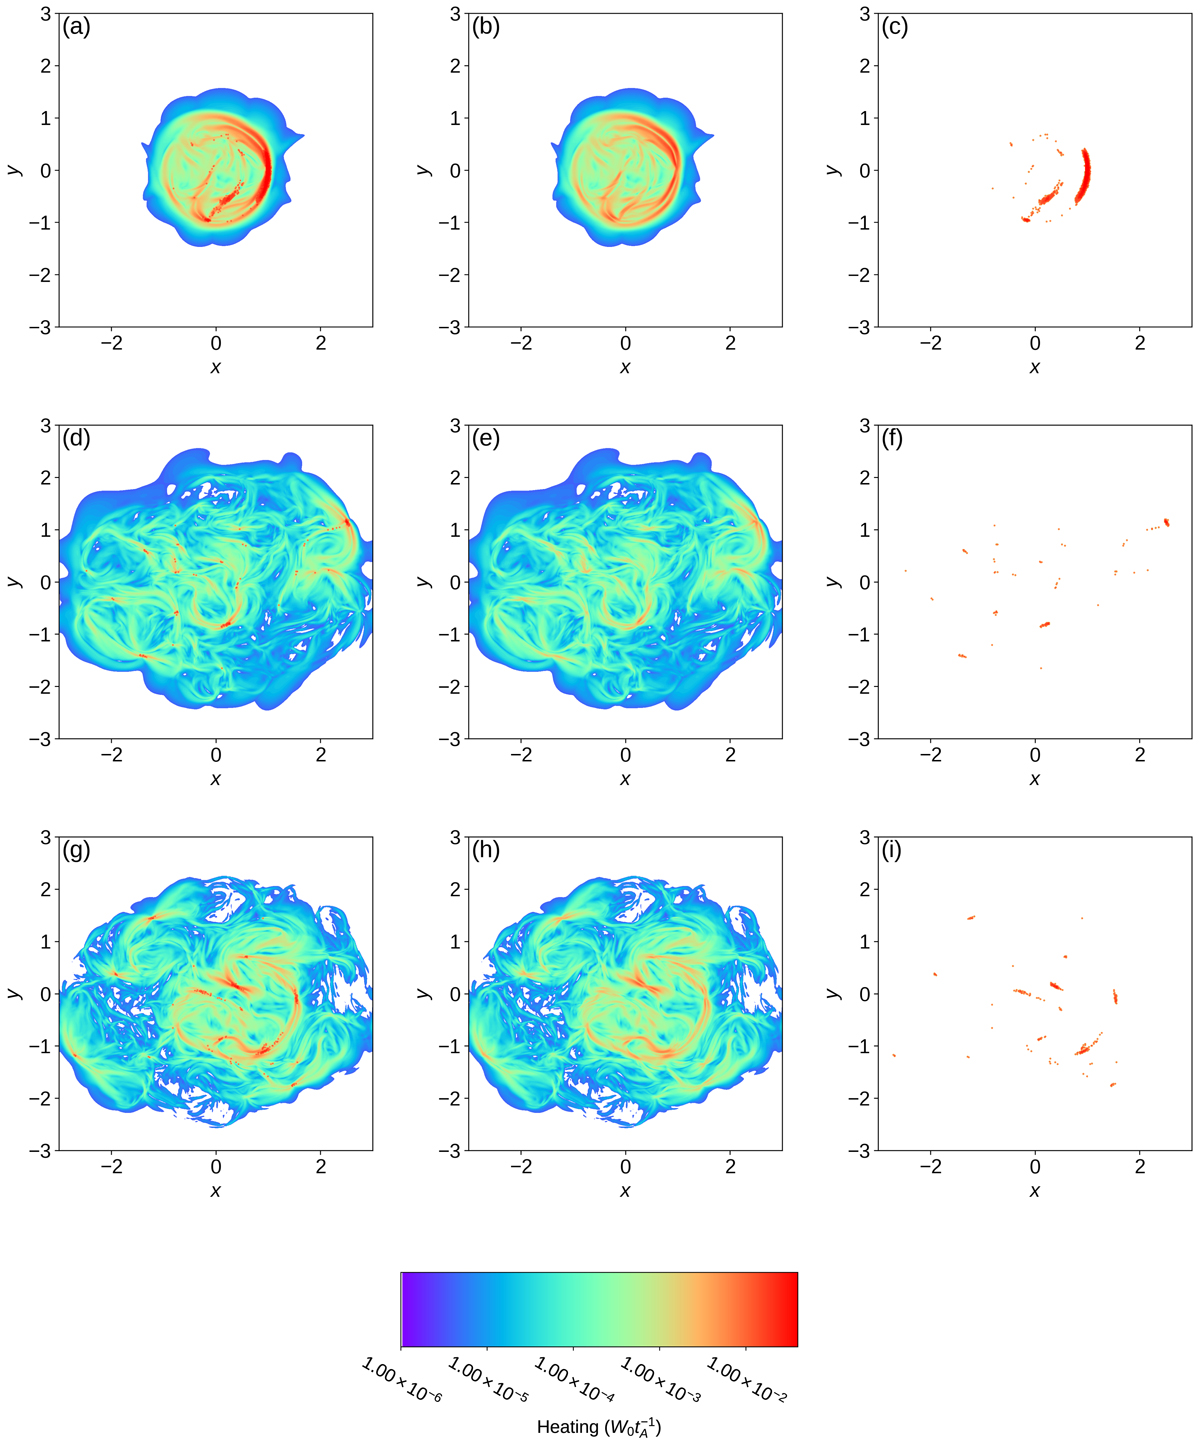
Contours in the mid-plane of total heating (left column), viscous heating (middle column), and Ohmic heating (right column), at t = 200 (top row), t = 400 (middle row), and t = 700 (bottom row). The total heating in the plane in each plot (in dimensions ![]() ) is (a) 8.81 × 10⁻³, (b) 4.30 × 10⁻³, (c) 4.52 × 10⁻³, (d) 1.50 × 10⁻³, (e) 1.10 × 10⁻³, (f) 4.05 × 10⁻⁴, (g) 2.99 × 10⁻³, (h) 2.24 × 10⁻³, and (i) 7.51 × 10⁻⁴. Colours are found with the same logarithmic scale as was used in Fig. 7. Although, numerically, heating is recorded outside the shaded regions below the minimum of 10−6 on the colour bar, it is here set in white.
) is (a) 8.81 × 10⁻³, (b) 4.30 × 10⁻³, (c) 4.52 × 10⁻³, (d) 1.50 × 10⁻³, (e) 1.10 × 10⁻³, (f) 4.05 × 10⁻⁴, (g) 2.99 × 10⁻³, (h) 2.24 × 10⁻³, and (i) 7.51 × 10⁻⁴. Colours are found with the same logarithmic scale as was used in Fig. 7. Although, numerically, heating is recorded outside the shaded regions below the minimum of 10−6 on the colour bar, it is here set in white.
Current usage metrics show cumulative count of Article Views (full-text article views including HTML views, PDF and ePub downloads, according to the available data) and Abstracts Views on Vision4Press platform.
Data correspond to usage on the plateform after 2015. The current usage metrics is available 48-96 hours after online publication and is updated daily on week days.
Initial download of the metrics may take a while.