Fig. 8.
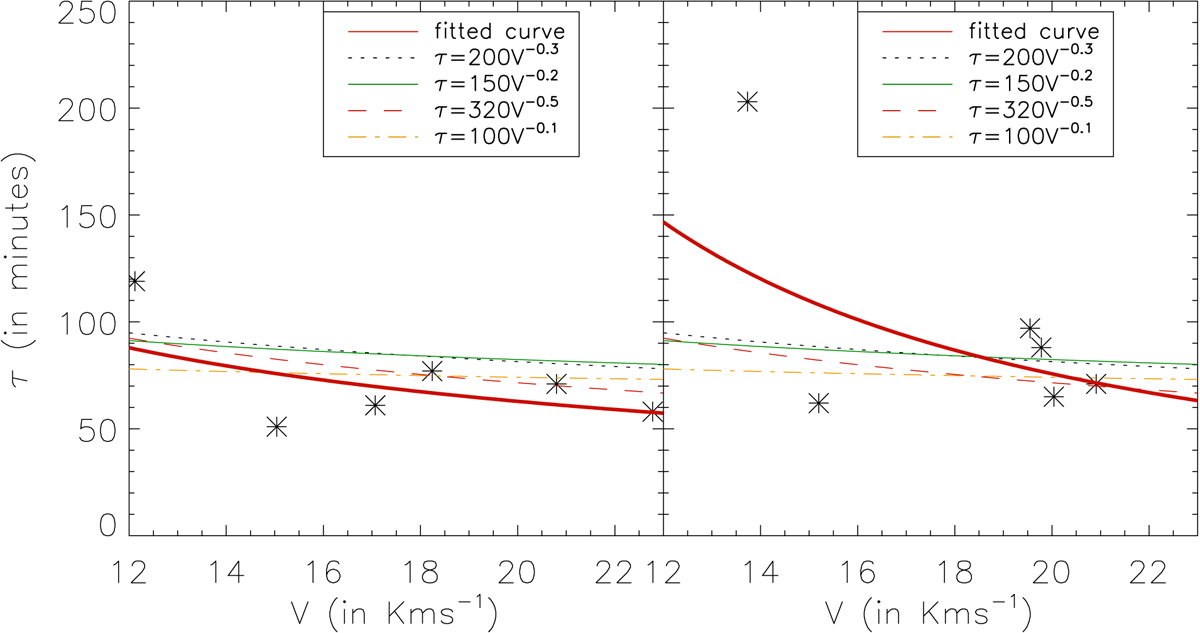
Left panel: variation of damping time (τ) with velocity (v) of the oscillation in AIA 171 Å. Right panel: similar to the left but for AIA 193 Å. The black asterisks represent the observed data. A non-linear curve given by the relation τ ∼ a Vb is fitted to the data. Curves with different exponents and constants are overplotted in different colours and line styles. The curve in solid red in the left (right) panel represents the best-fit curve with a and b (in the relation τ ∼ a Vb) of 450 (3657) and −0.7 (−1.3), respectively.
Current usage metrics show cumulative count of Article Views (full-text article views including HTML views, PDF and ePub downloads, according to the available data) and Abstracts Views on Vision4Press platform.
Data correspond to usage on the plateform after 2015. The current usage metrics is available 48-96 hours after online publication and is updated daily on week days.
Initial download of the metrics may take a while.