Free Access
Fig. 3.
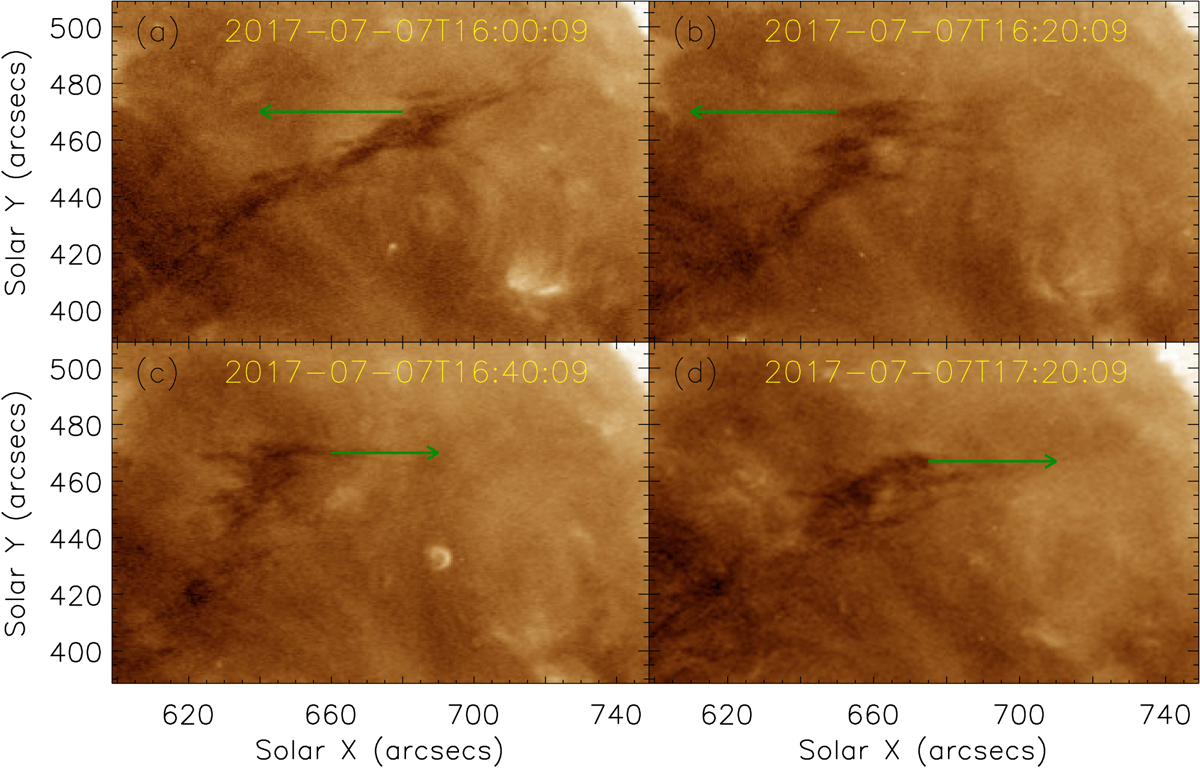
Temporal evolution of the filament in AIA 193 Å in different phases of oscillations. The arrows in green represent the direction of the movement of the filament threads at different instances. An animated version of this figure is available online.
Current usage metrics show cumulative count of Article Views (full-text article views including HTML views, PDF and ePub downloads, according to the available data) and Abstracts Views on Vision4Press platform.
Data correspond to usage on the plateform after 2015. The current usage metrics is available 48-96 hours after online publication and is updated daily on week days.
Initial download of the metrics may take a while.