Fig. 14.
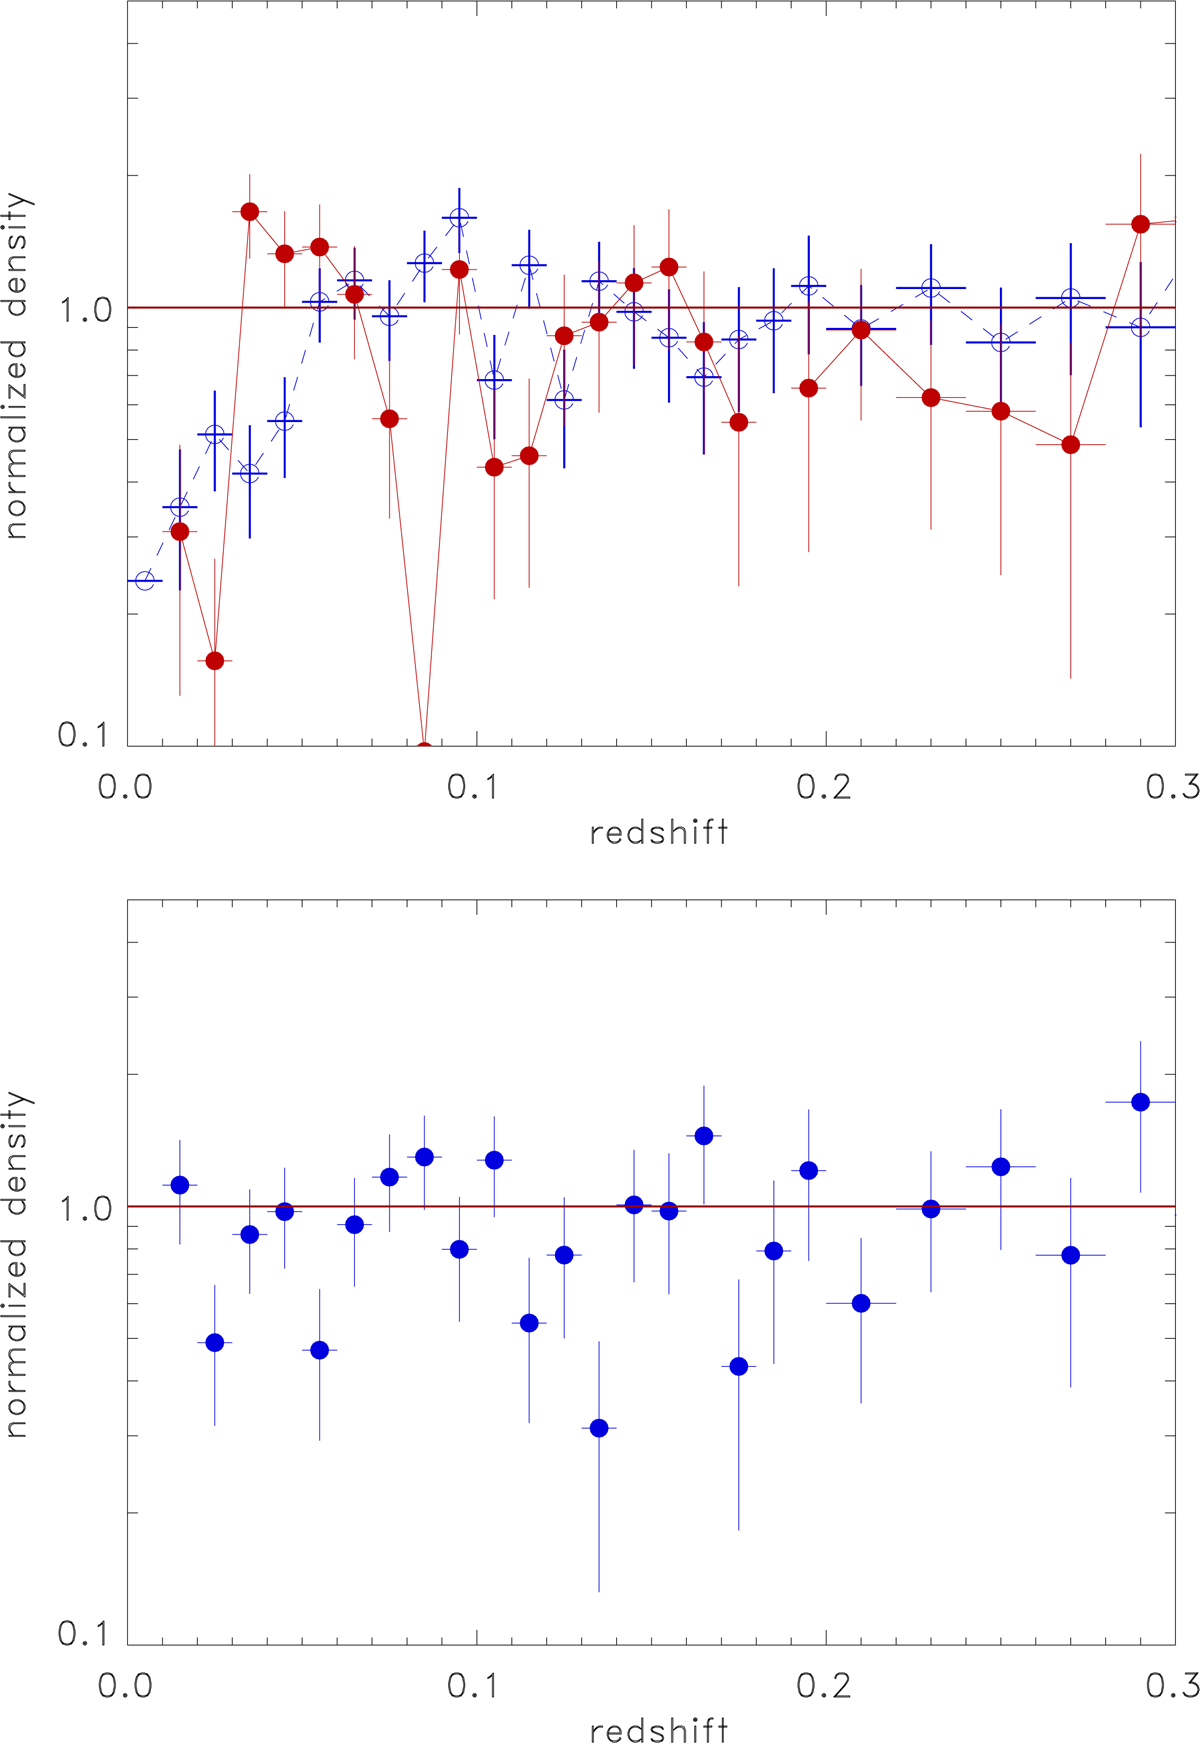
Top: density distribution of CLASSIX clusters as a function of redshift in the high-density region in the southern sky, D (red filled circles), and the low-density region, E (blue open circles). Bottom: density distribution of CLASSIX clusters as a function of redshift in the northern high-density region, F. This seems to be one of the densest regions at z ≤ 0.04.
Current usage metrics show cumulative count of Article Views (full-text article views including HTML views, PDF and ePub downloads, according to the available data) and Abstracts Views on Vision4Press platform.
Data correspond to usage on the plateform after 2015. The current usage metrics is available 48-96 hours after online publication and is updated daily on week days.
Initial download of the metrics may take a while.