Fig. 9.
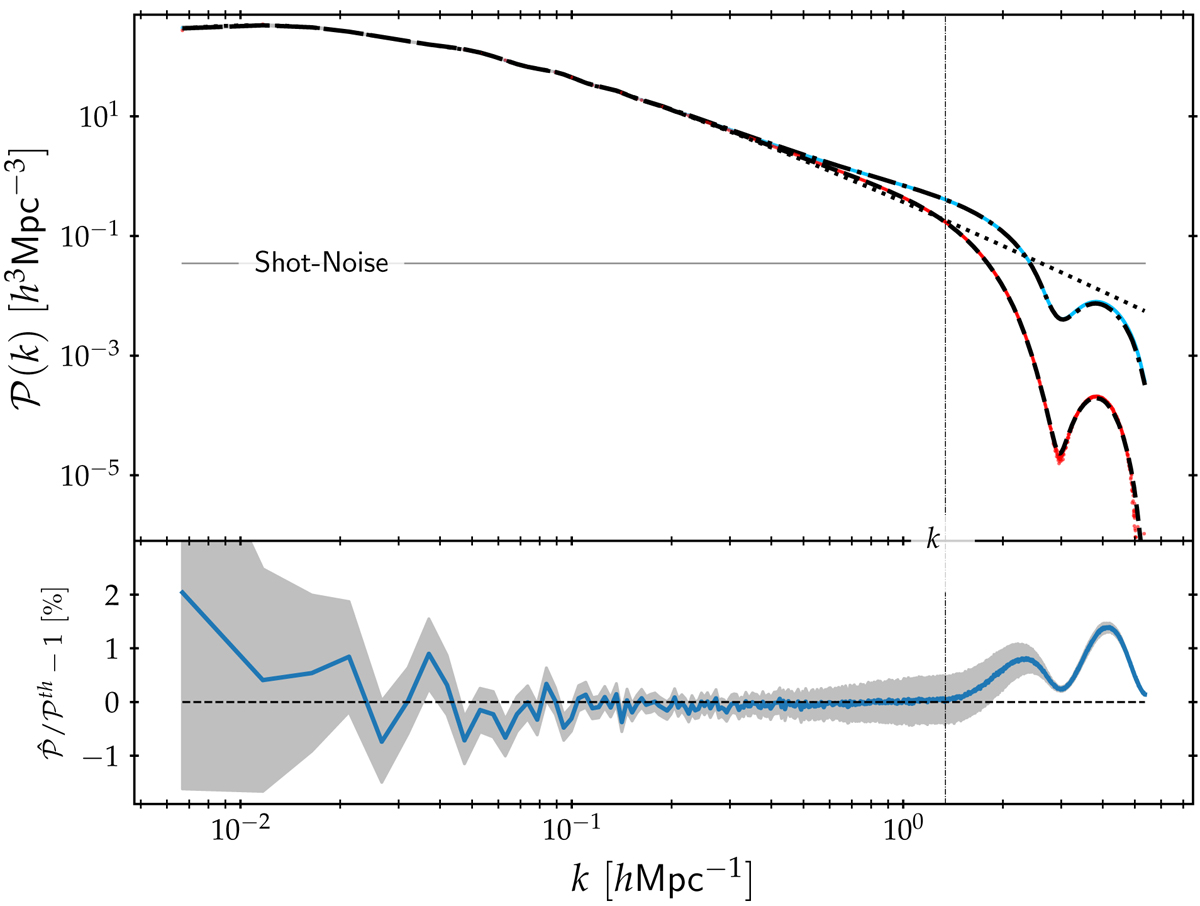
Top: measured power spectra averaged over 100 realisations of the Poissonian LN field for the Top-Hat interpolation scheme (blue curve with prediction in dash-dotted black line) and for the linear interpolation scheme (red curve and prediction in dashed line). The shot noise is subtracted from measures (solid horizontal black line) and is about 3.48 × 10⁻² h3 Mpc3. The dotted black curve represents the alias-free theoretical power spectrum computed by CLASS. Bottom: relative deviation in percentage between the averaged realisations (with shot noise contribution) and prediction (with the same shot noise added) in blue line with error bar in grey for the Top-Hat interpolation scheme. Snapshots are computed for a grid of size L = 1200 h−1 Mpc and parameter Ns = 512. Here comparisons are made well beyond the Nyquist (vertical line) frequency at kN ∼ 1.34 h Mpc−1.
Current usage metrics show cumulative count of Article Views (full-text article views including HTML views, PDF and ePub downloads, according to the available data) and Abstracts Views on Vision4Press platform.
Data correspond to usage on the plateform after 2015. The current usage metrics is available 48-96 hours after online publication and is updated daily on week days.
Initial download of the metrics may take a while.