Fig. 6.
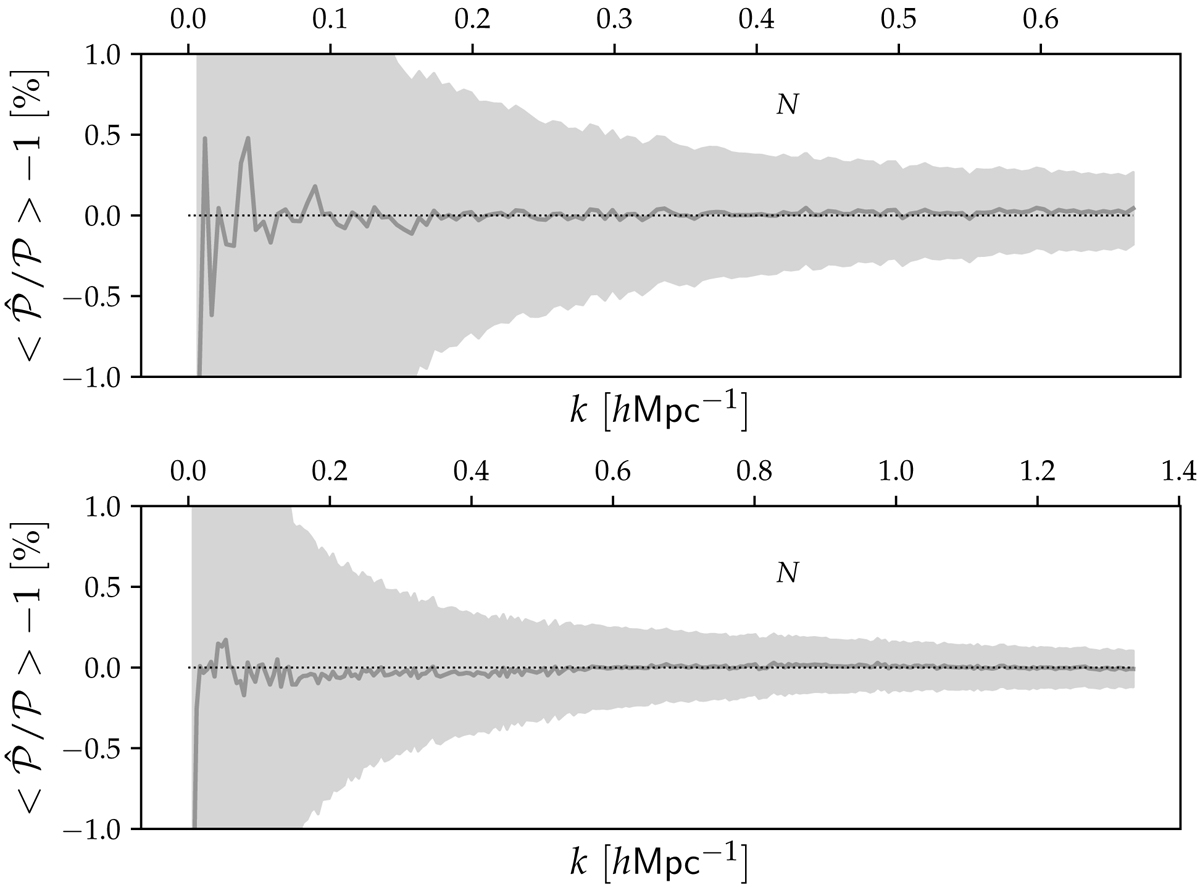
Averaged 3D power spectrum compared to the expected 3D power spectrum, for 1000 realisations of the density field. The shell-averaged monopoles of this residuals in shells of width |k|−kf/2 < |k|< |k|+kf/2 were then computed. The result is presented as percentage with error bars. The setting used is a sampling number per side of 256 in the top panel and 512 for the other, all in a box of size L = 1200 h−1 Mpc at redshift z = 0. Both results are computed up to the Nyquist frequency.
Current usage metrics show cumulative count of Article Views (full-text article views including HTML views, PDF and ePub downloads, according to the available data) and Abstracts Views on Vision4Press platform.
Data correspond to usage on the plateform after 2015. The current usage metrics is available 48-96 hours after online publication and is updated daily on week days.
Initial download of the metrics may take a while.