Table 2.
Column densities(a) for the NGC 7469 outflow components.
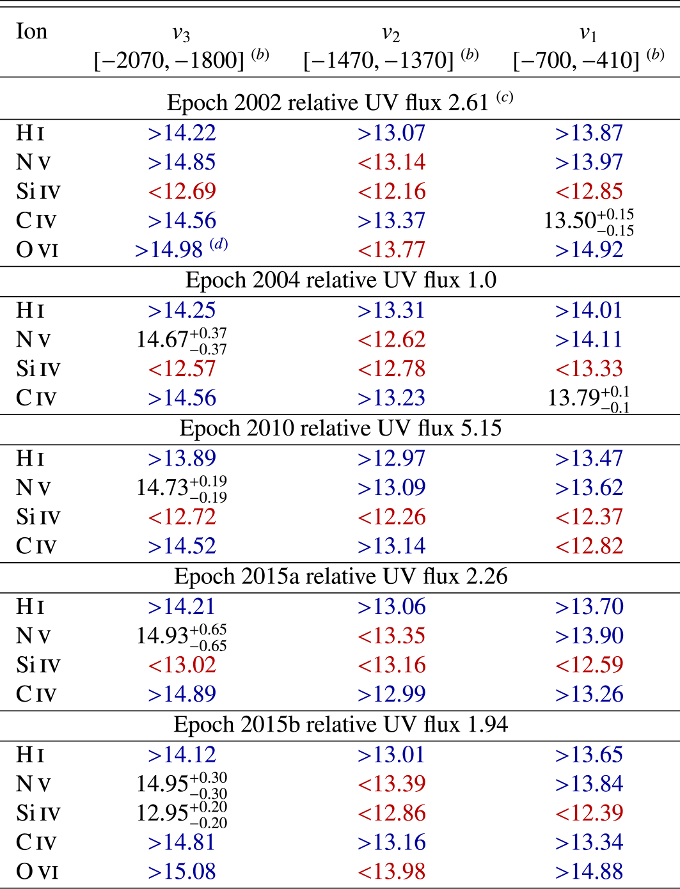
Notes. (a) Table values are log column densities (cm−2). Lower limit are shown in blue, upper limits in red. Measurements (and errors) are shown in black. (b) Integration limits in km s−1. (c) Flux at 1170 Å relative to the 2004 flux (2004 flux at 1170 Å = 1.20 × 10⁻¹⁴ erg cm−2 s−1 Å−1). (d) The O VI absorption trough only exists in Epoch 2002 and Epoch 2015b. See Sect. 2 for more details.
Current usage metrics show cumulative count of Article Views (full-text article views including HTML views, PDF and ePub downloads, according to the available data) and Abstracts Views on Vision4Press platform.
Data correspond to usage on the plateform after 2015. The current usage metrics is available 48-96 hours after online publication and is updated daily on week days.
Initial download of the metrics may take a while.