Fig. 4.
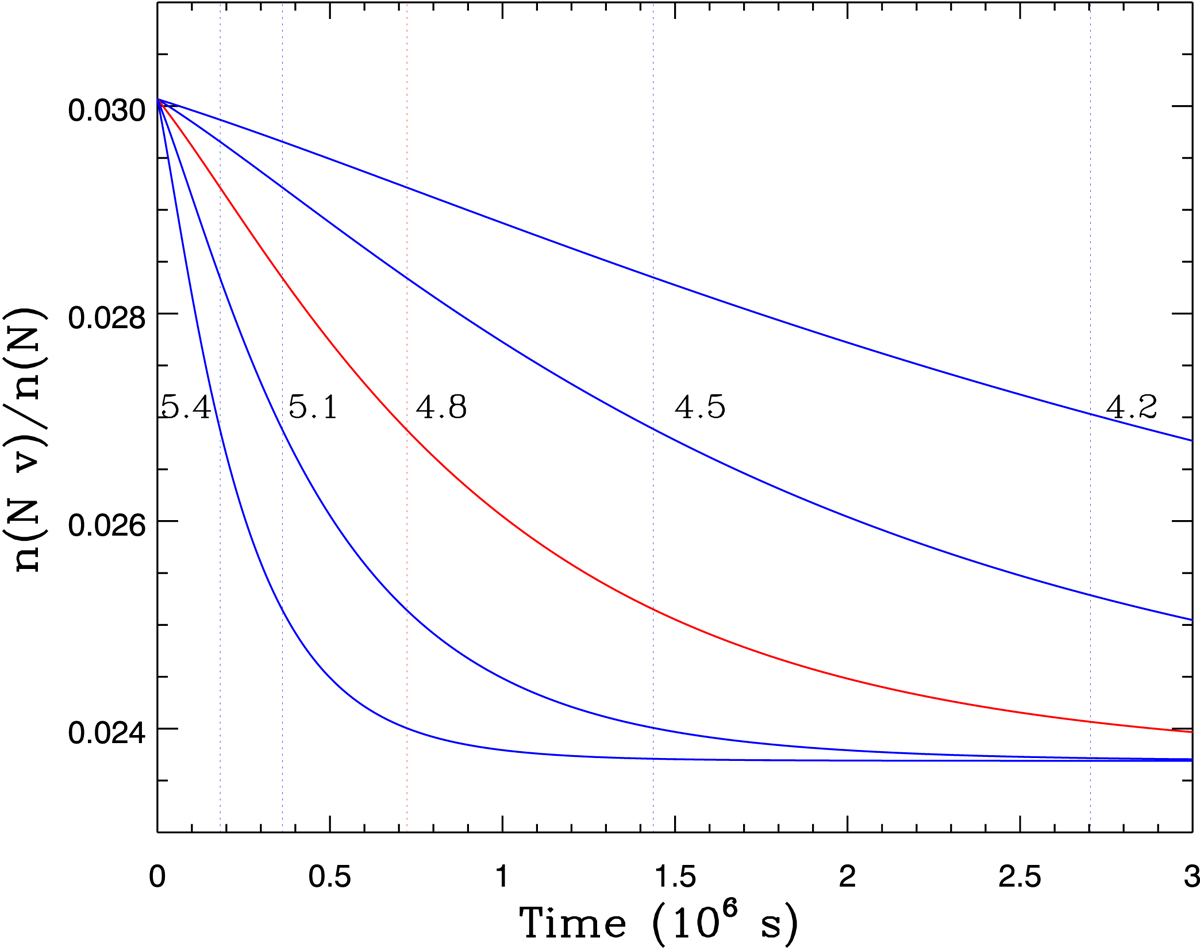
Time-dependent photoionization solutions: starting from the photoionization equilibrium for the 2015b epoch (shown in the bottom panel of Fig. 3), we assume a step-function flux increase of 13% (see text), and track the changes in the relative fraction of N V for a range of ne. The log(ne) of each solution labels each curve. The shortest time-scale where we measured definitive changes in the N V trough between two epochs was 700 000 s. In red we mark the N V fraction curve that shows a 50% change between the initial and final values after 700 000 s.
Current usage metrics show cumulative count of Article Views (full-text article views including HTML views, PDF and ePub downloads, according to the available data) and Abstracts Views on Vision4Press platform.
Data correspond to usage on the plateform after 2015. The current usage metrics is available 48-96 hours after online publication and is updated daily on week days.
Initial download of the metrics may take a while.