Fig. B.3.
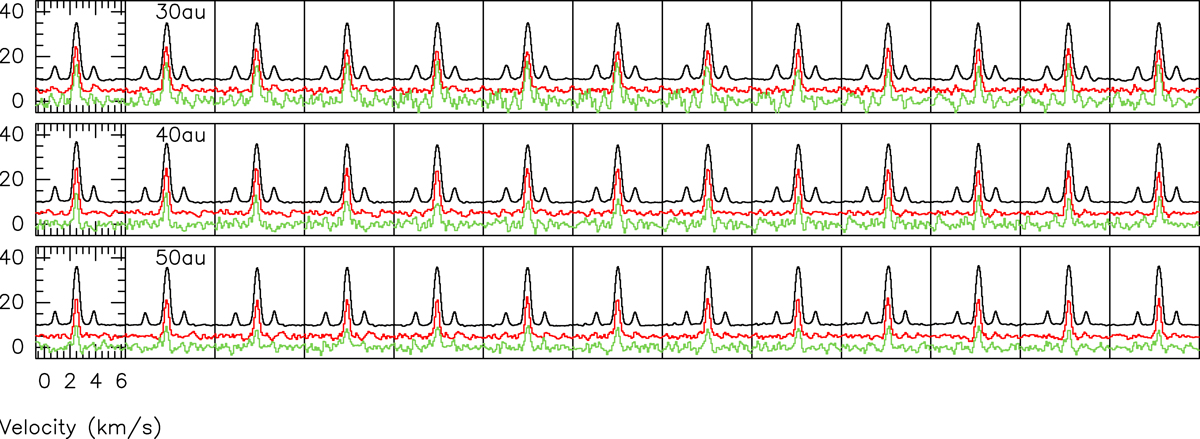
Spectra of HCN (black), H13CN (red, ×5), and HC15N (green, ×10) averaged within each Keplerian velocity channel (see, e.g., Table B.1) and within annuli of constant thickness 5 au, centered at 30, 40, and 50 au (from top to bottom). The specific intensity scale is K using K/(Jy beam−1) conversion factors of 178.7, 188.1, and 189.0 for HCN, H13CN, and HC15N, respectively. The spectra are shifted vertically for the sake of legibility.
Current usage metrics show cumulative count of Article Views (full-text article views including HTML views, PDF and ePub downloads, according to the available data) and Abstracts Views on Vision4Press platform.
Data correspond to usage on the plateform after 2015. The current usage metrics is available 48-96 hours after online publication and is updated daily on week days.
Initial download of the metrics may take a while.