Fig. 3.
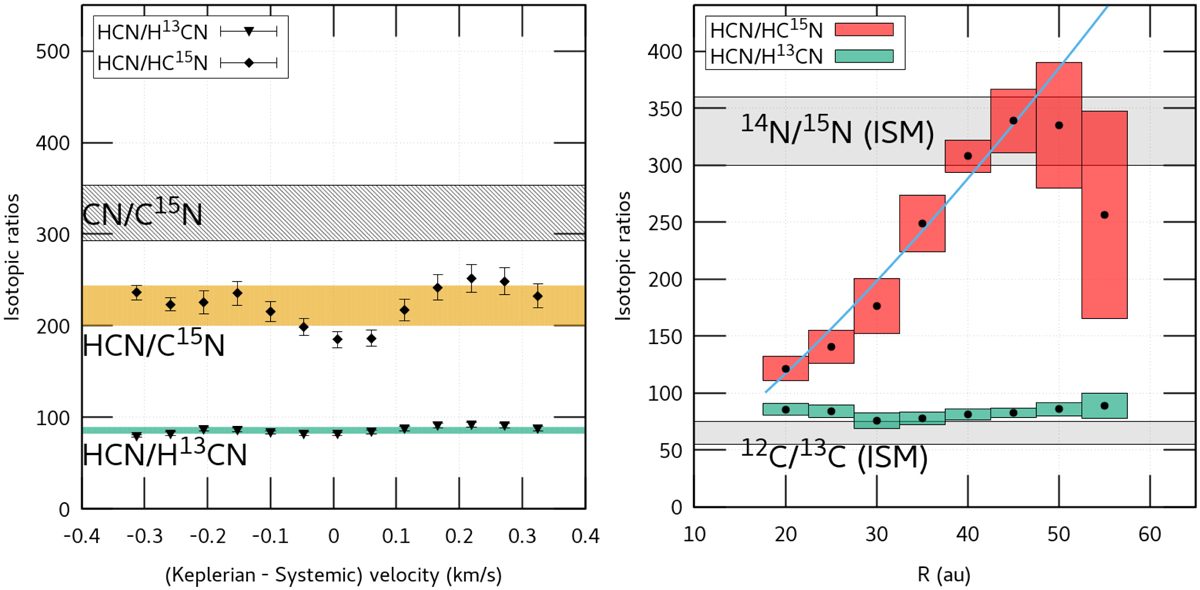
Left: HCN/HC15N and HCN/H13CN isotopic ratios in each Keplerian channel derived from the spatially averaged procedure (see Sect. 3.1). The colored bands indicate the average value ±1σ. The spatially averaged CN/C15N ratio from Paper I is shown as a hatched rectangle. Right: radial dependence (see Sect. 3.2) of the HCN/H13CN and HCN/HC15N ratios. Each box is 5 au wide (one-third of the HPBW) and ±1σ in height. The full line shows the best fit of a power law to the 15N ratio, with a slope of 1.3. The gray shaded areas are the present-day 14N/15N and 12C/13C elemental ratios in the local ISM (330 ± 30 (Paper I) and 65 ± 10 Halfen et al. 2017, respectively).
Current usage metrics show cumulative count of Article Views (full-text article views including HTML views, PDF and ePub downloads, according to the available data) and Abstracts Views on Vision4Press platform.
Data correspond to usage on the plateform after 2015. The current usage metrics is available 48-96 hours after online publication and is updated daily on week days.
Initial download of the metrics may take a while.