Fig. 1.
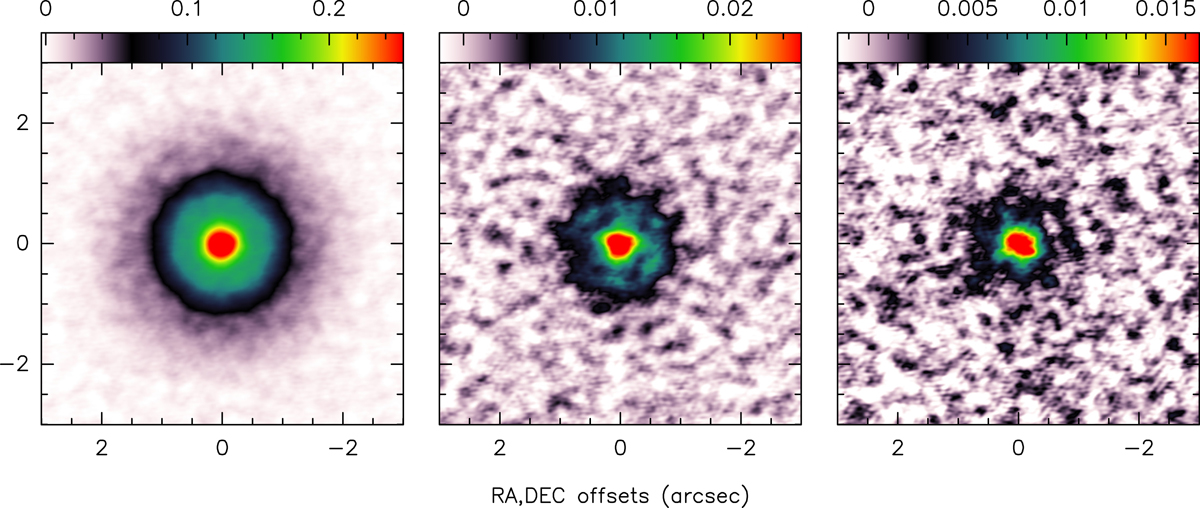
Integrated intensity maps of HCN, H13CN, and HC15N (from left to right) in Jy beam km s−1. The maps are centered at α = 11:01:51.81150, δ = −34:42:17.2636 (J2000.0). The visibilities were projected on the same spatial grid and convolved to a synthesized beam of HPBW 0.26″ × 0.21″. The emission is centered on the systemic velocity of 2.83 km s−1 and is integrated over 5 km s−1 for HCN and 2 km s−1 for the less abundant isotopologs.
Current usage metrics show cumulative count of Article Views (full-text article views including HTML views, PDF and ePub downloads, according to the available data) and Abstracts Views on Vision4Press platform.
Data correspond to usage on the plateform after 2015. The current usage metrics is available 48-96 hours after online publication and is updated daily on week days.
Initial download of the metrics may take a while.