Fig. A.2
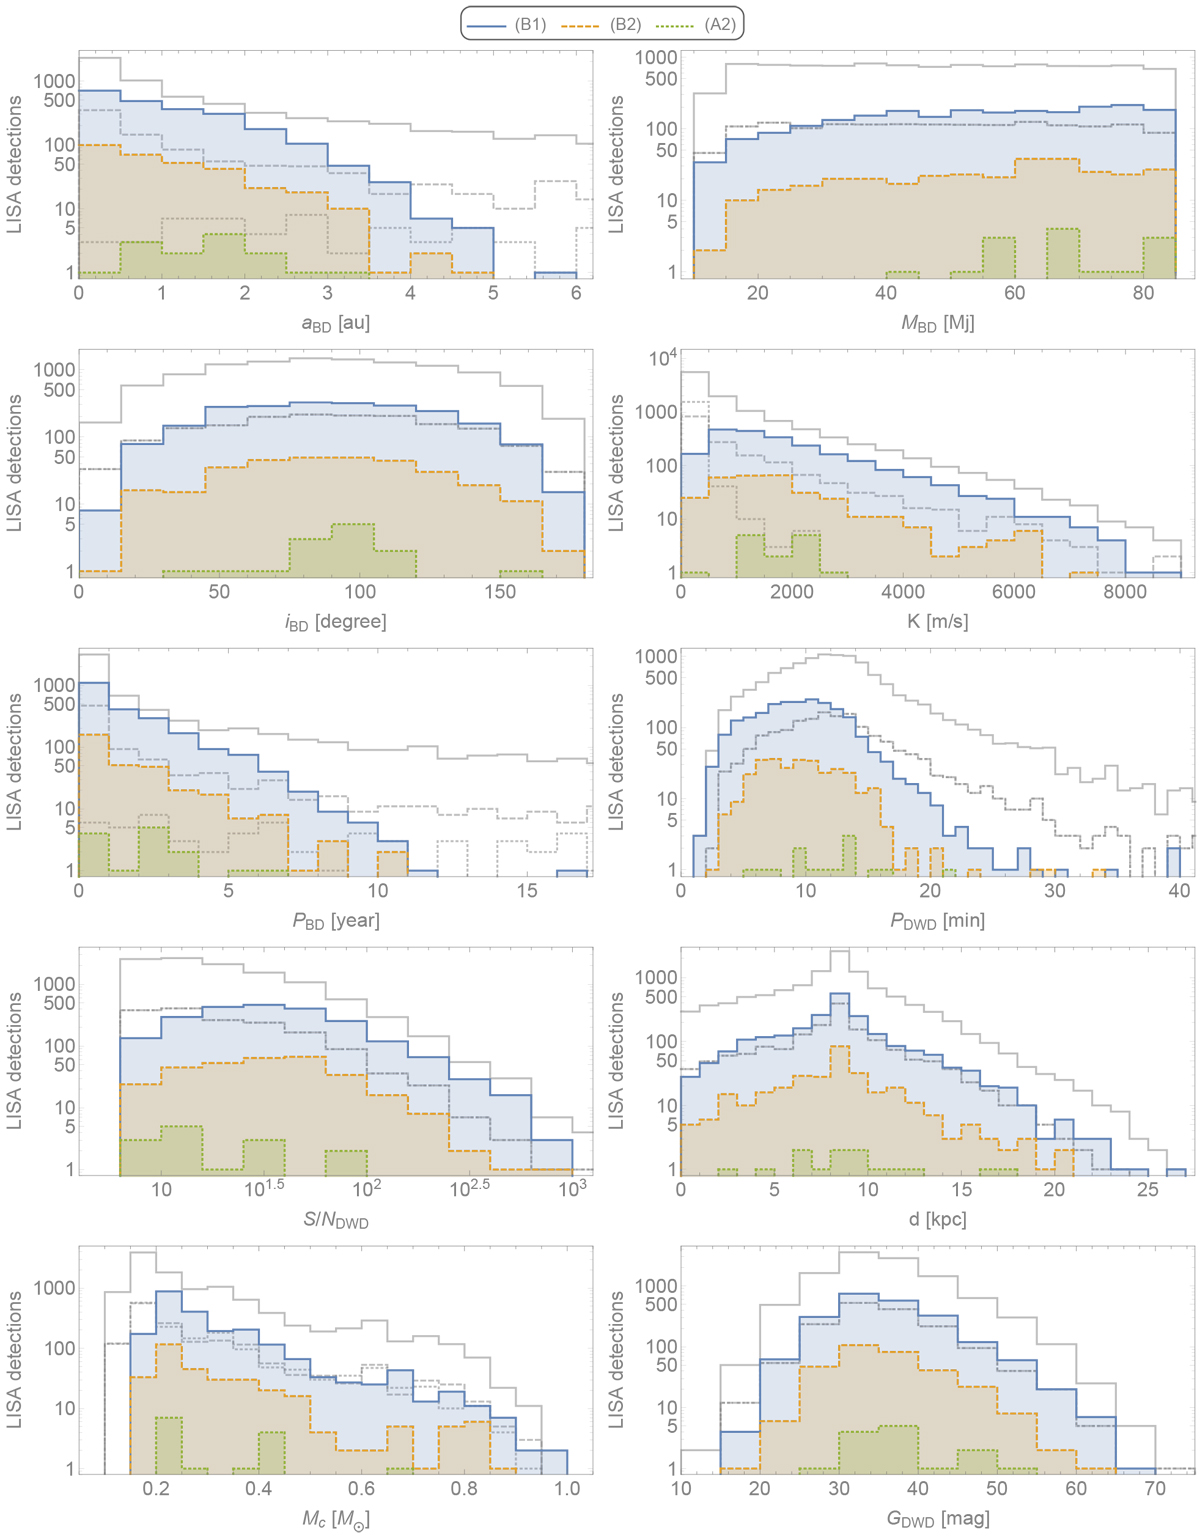
Injected vs. detected population distributions for BDs and its hosts in the optimistic (B1, solid), intermediate (B2, dashed), and pessimistic (A2, dotted) scenarios (cf. Table 1). The injected population distribution of the three scenarios is shown in grey for comparison. From top to bottom and left to right: BD semi-major axis, mass, inclination, K, BD period, DWD period (denoted as PDWD rather than Pb), S/N of the DWD (denoted as S/NDWD rather than S/N), system distance, chirp mass, total Gaia G magnitude of the two WDs.
Current usage metrics show cumulative count of Article Views (full-text article views including HTML views, PDF and ePub downloads, according to the available data) and Abstracts Views on Vision4Press platform.
Data correspond to usage on the plateform after 2015. The current usage metrics is available 48-96 hours after online publication and is updated daily on week days.
Initial download of the metrics may take a while.