Fig. 4
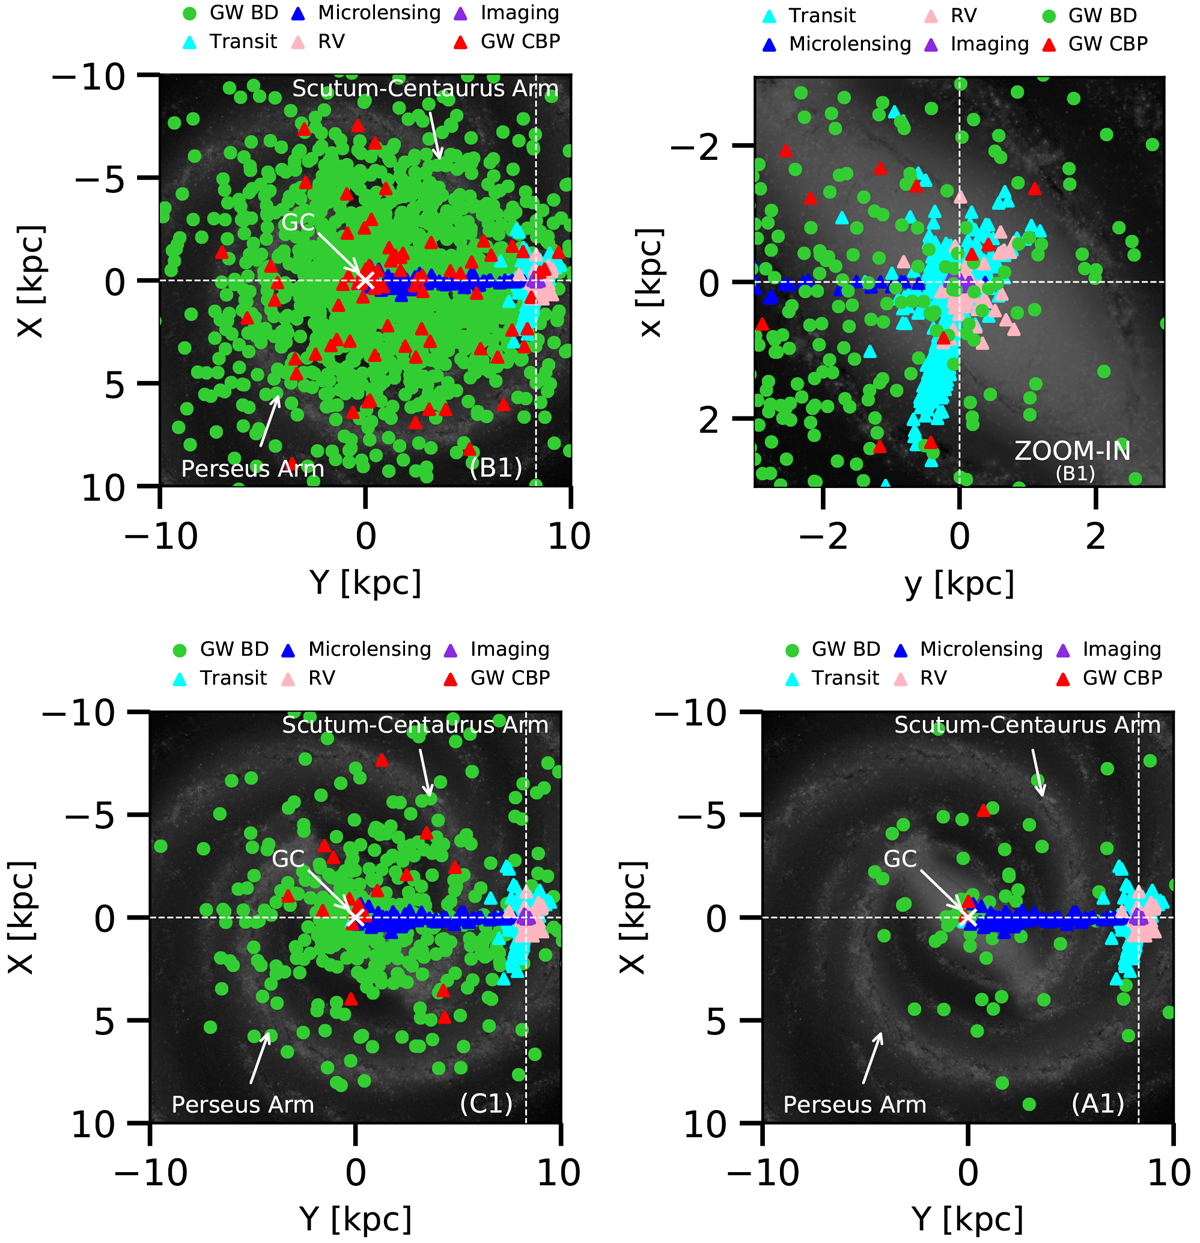
Optimistic (top left, B1) with its zoom-in on the solar region (top right, heliocentric coordinates), intermediate (bottom left, C1), and pessimistic (bottom right, A1) scenarios. Each plot shows the location of the binaryWD system with a planetary companion (red) and BD (green) detection through GWs. In each panel we also plot the known detected exoplanets’s host-star (see legend for colour scheme; data from https:// exoplanetarchive.ipac.caltech.edu). We note that data overlay a face-on black and white image of the Milky Way for Galactic location reference purposes.
Current usage metrics show cumulative count of Article Views (full-text article views including HTML views, PDF and ePub downloads, according to the available data) and Abstracts Views on Vision4Press platform.
Data correspond to usage on the plateform after 2015. The current usage metrics is available 48-96 hours after online publication and is updated daily on week days.
Initial download of the metrics may take a while.