Open Access
Fig. 2
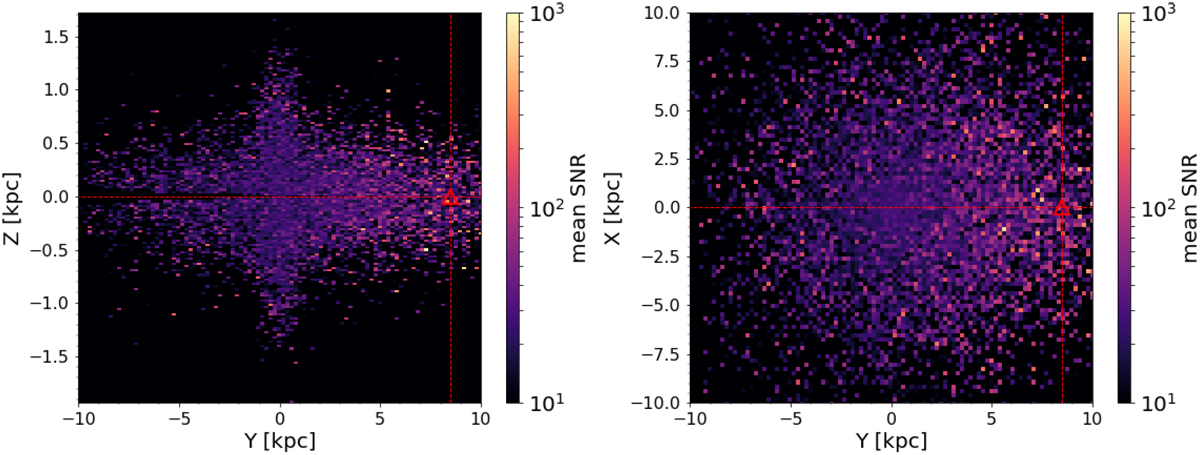
Signal-to-noise map of DWDs detected by LISA (4 yr) in the galactocentric Cartesian coordinate system. The colour represents the mean S/N per bin. The red triangle identifies the position of the LISA detector in our simulation.
Current usage metrics show cumulative count of Article Views (full-text article views including HTML views, PDF and ePub downloads, according to the available data) and Abstracts Views on Vision4Press platform.
Data correspond to usage on the plateform after 2015. The current usage metrics is available 48-96 hours after online publication and is updated daily on week days.
Initial download of the metrics may take a while.