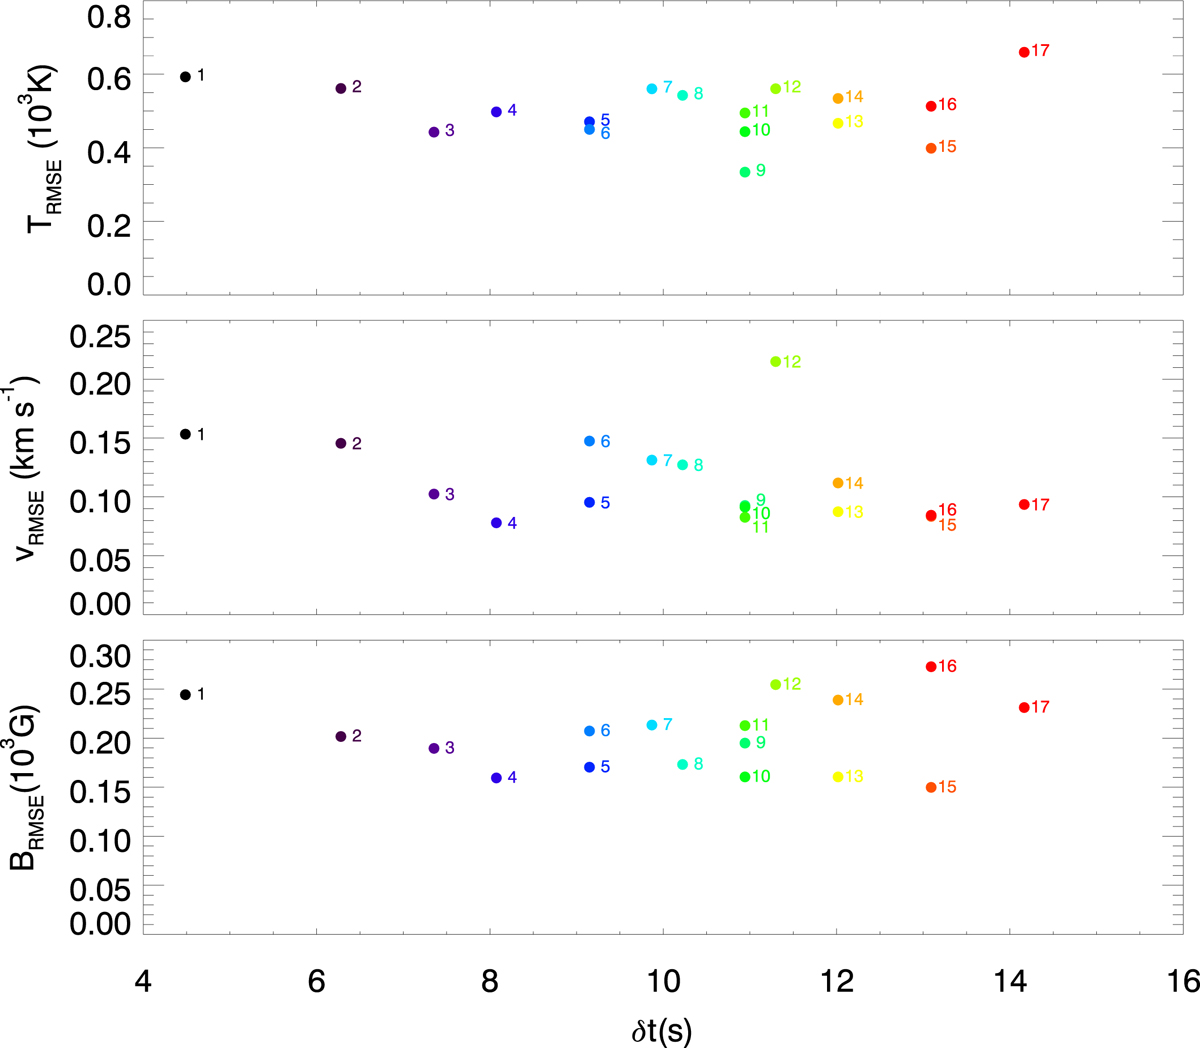
Fig. 5.

RMSE between the inferences from inversions and actual values from the numerical simulation as a function of the scanning time for temperature (top panel), LOS velocity (middle panel), and vertical magnetic field (bottom panel). The spectral samplings were selected following criterion D. Color code and numbers indicate the wavelength sampling employed in each case, as given in the fourth column of Fig. 1.
Current usage metrics show cumulative count of Article Views (full-text article views including HTML views, PDF and ePub downloads, according to the available data) and Abstracts Views on Vision4Press platform.
Data correspond to usage on the plateform after 2015. The current usage metrics is available 48-96 hours after online publication and is updated daily on week days.
Initial download of the metrics may take a while.


