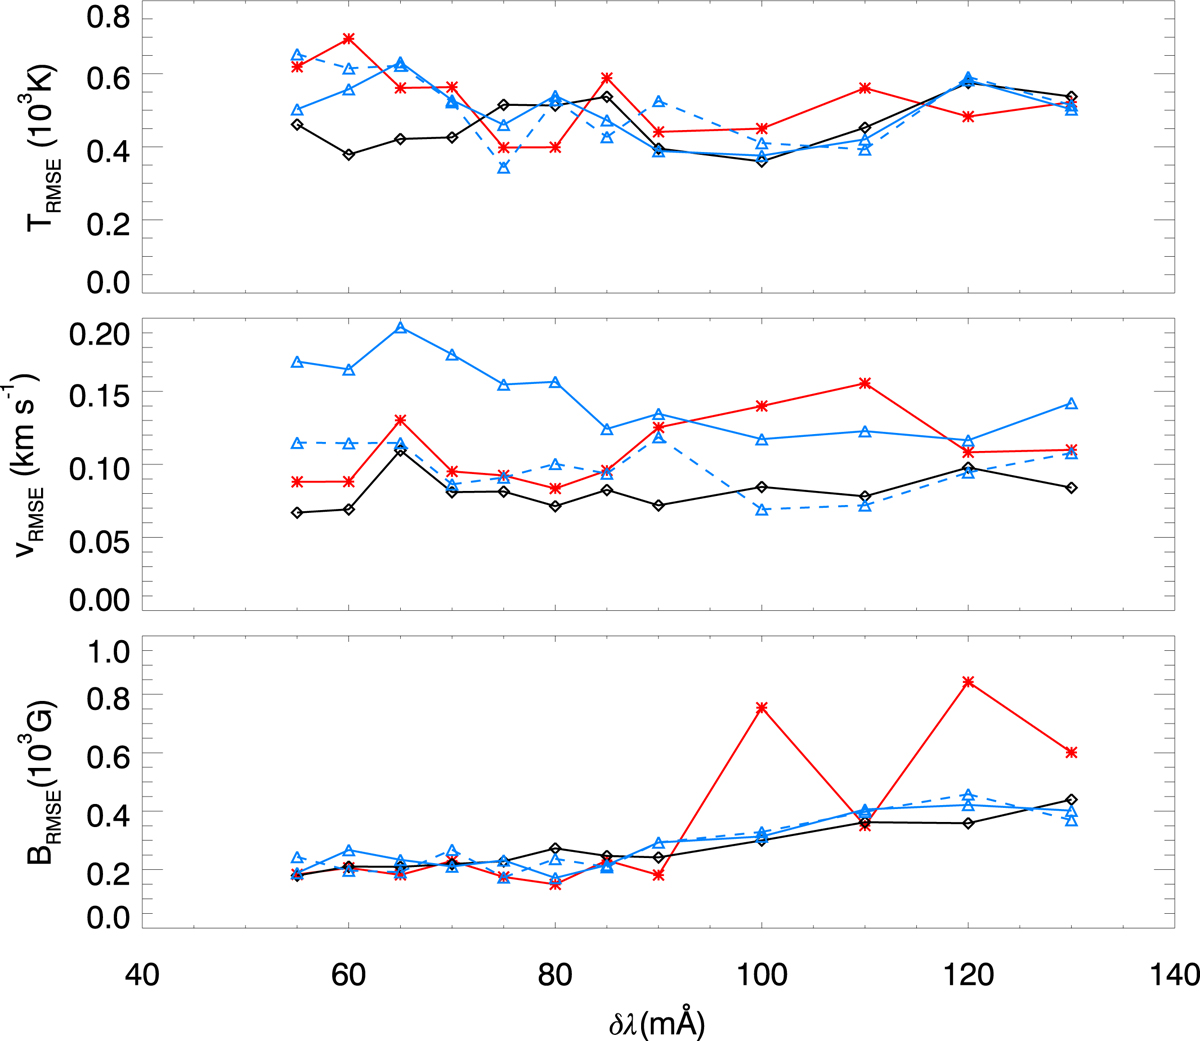
Fig. 4.

RMSE between inferences from the inversions and the actual values from the numerical simulation as a function of the wavelength resolution δλ for the temperature (top panel), LOS velocity (middle panel), and vertical magnetic field (bottom panel). Each color line corresponds to a wavelength sampling selected following a different criteria. Blue line: criterion A (first column from Fig. 1), black line: criterion B (second column from Fig. 1), red line: criterion C (third column from Fig. 1). The solid line shows the results for synthetic Stokes profiles constructed mimicking the acquisition strategy of imaging spectrographs (sequentially scanning the wavelengths of the profiles at successive time steps), whereas the dashed lines (only for criterion A) illustrate the error for synthetic profiles constructed with all the wavelength gathered at the same time step.
Current usage metrics show cumulative count of Article Views (full-text article views including HTML views, PDF and ePub downloads, according to the available data) and Abstracts Views on Vision4Press platform.
Data correspond to usage on the plateform after 2015. The current usage metrics is available 48-96 hours after online publication and is updated daily on week days.
Initial download of the metrics may take a while.


