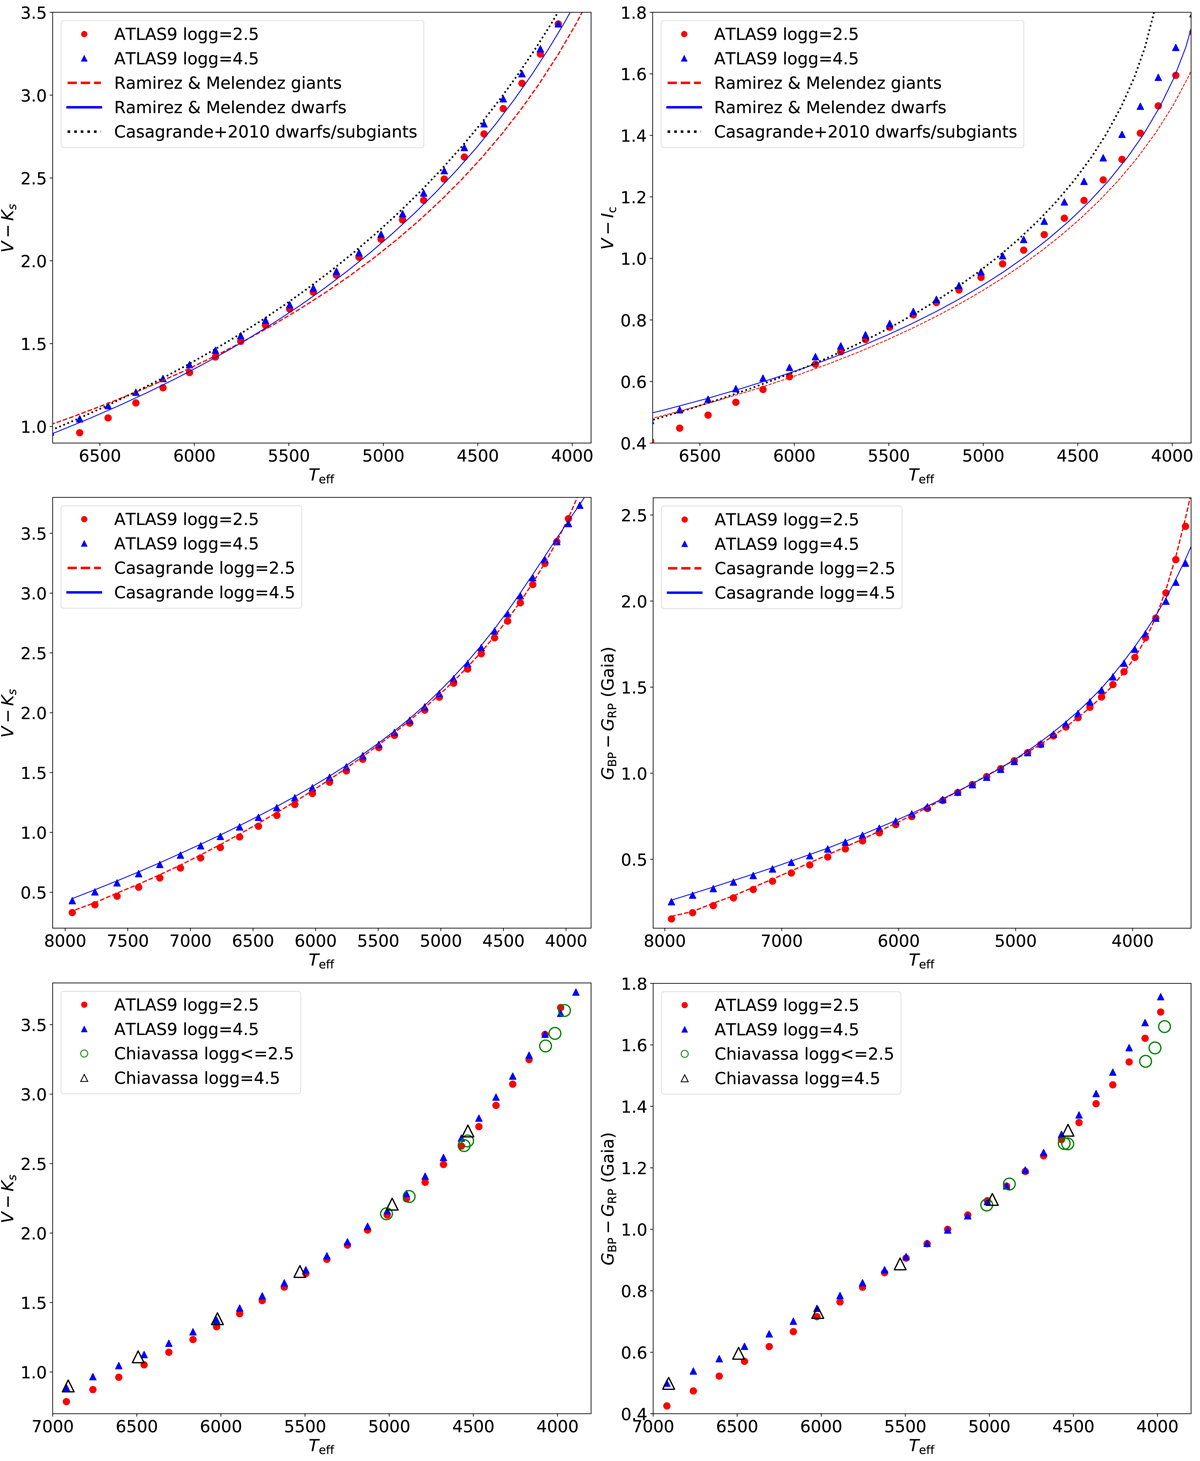
Fig. 3.

Comparison of temperature scales for [Fe/H] = 0 for standard filters (Bessell 1990; Maíz Apellániz 2006), 2MASS (Cohen et al. 2003), and Gaia filters. Upper panels: comparison with the empirical temperature scales from Ramírez & Meléndez (2005) (blue solid and red dashed lines) and Casagrande et al. (2010) (black dotted lines). Middle panels: comparison with the results from Casagrande & VandenBerg (2014, 2018a,b); the Gaia filters are from Evans et al. (2018). Lower panels: comparison with the 3D models from Chiavassa et al. (2018); the Gaia filters are those from Jordi et al. (2010). Our BCs are derived from ATLAS9 models.
Current usage metrics show cumulative count of Article Views (full-text article views including HTML views, PDF and ePub downloads, according to the available data) and Abstracts Views on Vision4Press platform.
Data correspond to usage on the plateform after 2015. The current usage metrics is available 48-96 hours after online publication and is updated daily on week days.
Initial download of the metrics may take a while.


