Fig. 2.
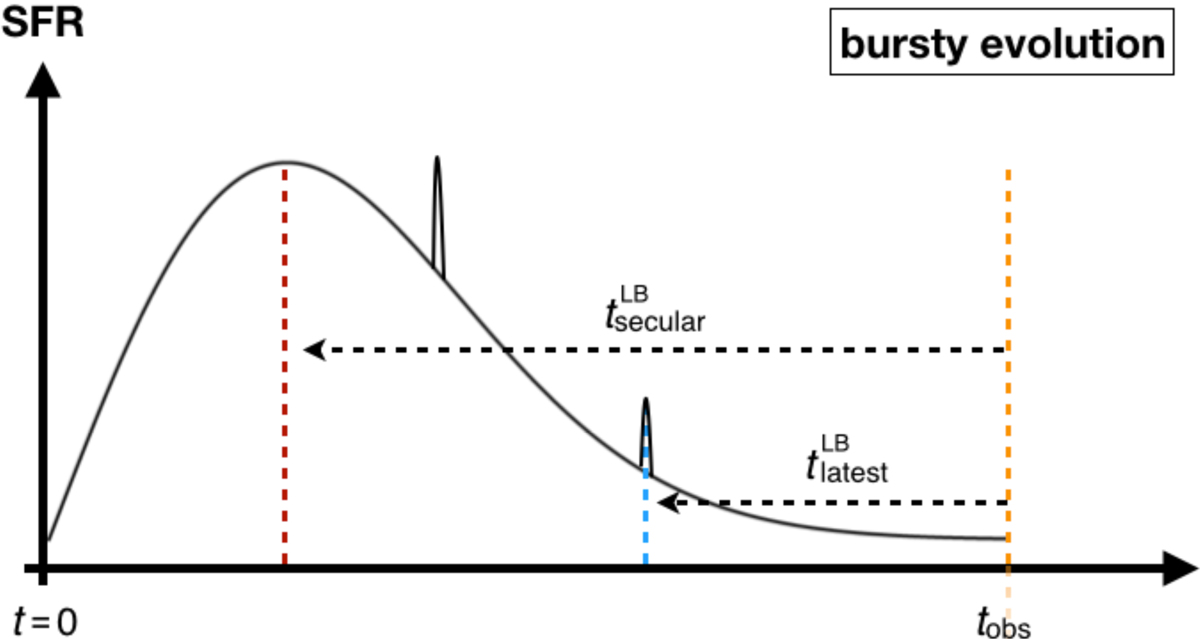
Sketch of bursty SFH of a galaxy that displays additional burst events after the peak of the secular SFH. The orange dashed line corresponds to the time from the beginning of the SFH (t = 0) to the time at which the galaxy was observed (tobs), the blue dashed line stands for the latest additional event of star formation superimposed to the secular SFH, and the red dashed line corresponds to the peak of the secular SFH. The look-back time to the peak of the secular SFH (![]() ) in this case differs from the look-back time to the latest peak of star formation (
) in this case differs from the look-back time to the latest peak of star formation (![]() ).
).
Current usage metrics show cumulative count of Article Views (full-text article views including HTML views, PDF and ePub downloads, according to the available data) and Abstracts Views on Vision4Press platform.
Data correspond to usage on the plateform after 2015. The current usage metrics is available 48-96 hours after online publication and is updated daily on week days.
Initial download of the metrics may take a while.