Free Access
Fig. 12.
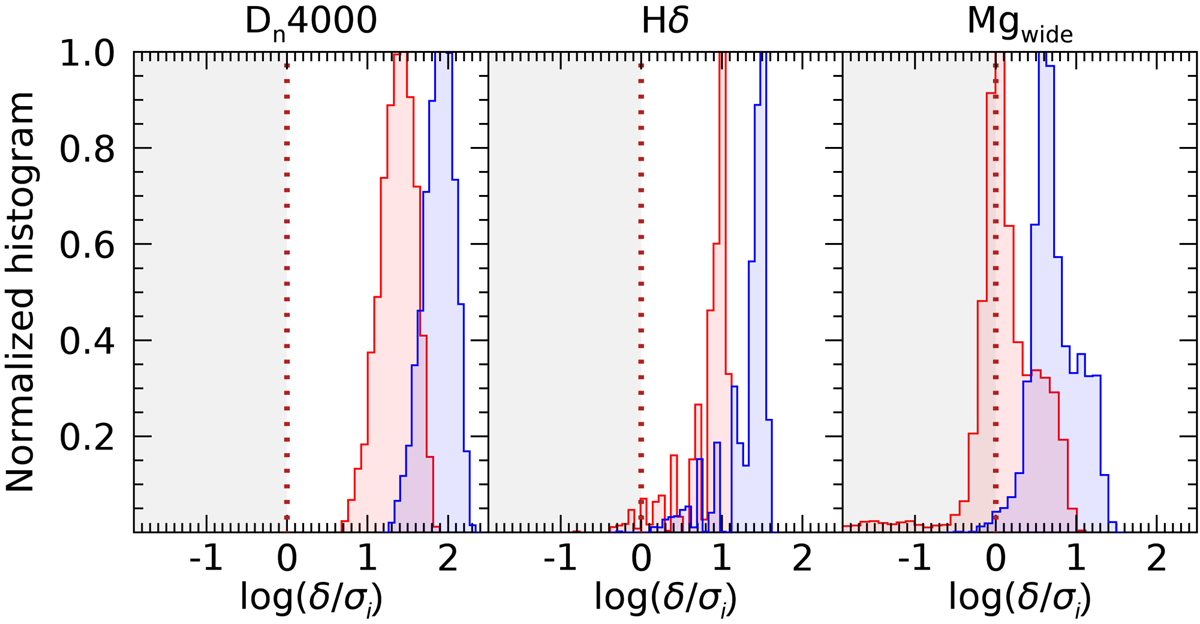
Distribution of the resolving power log(δi/σi) at z = 0.55 for Dn4000, Hδ, and Mgwide, respectively. Red histograms correspond to S/NI, obs = 10, while blue histograms stand for S/NI, obs = 30. The red dotted line separates the region where log(δi/σi) < 0 (in gray) from the one where log(δi/σi) > 0 (in white).
Current usage metrics show cumulative count of Article Views (full-text article views including HTML views, PDF and ePub downloads, according to the available data) and Abstracts Views on Vision4Press platform.
Data correspond to usage on the plateform after 2015. The current usage metrics is available 48-96 hours after online publication and is updated daily on week days.
Initial download of the metrics may take a while.