Fig. 5.
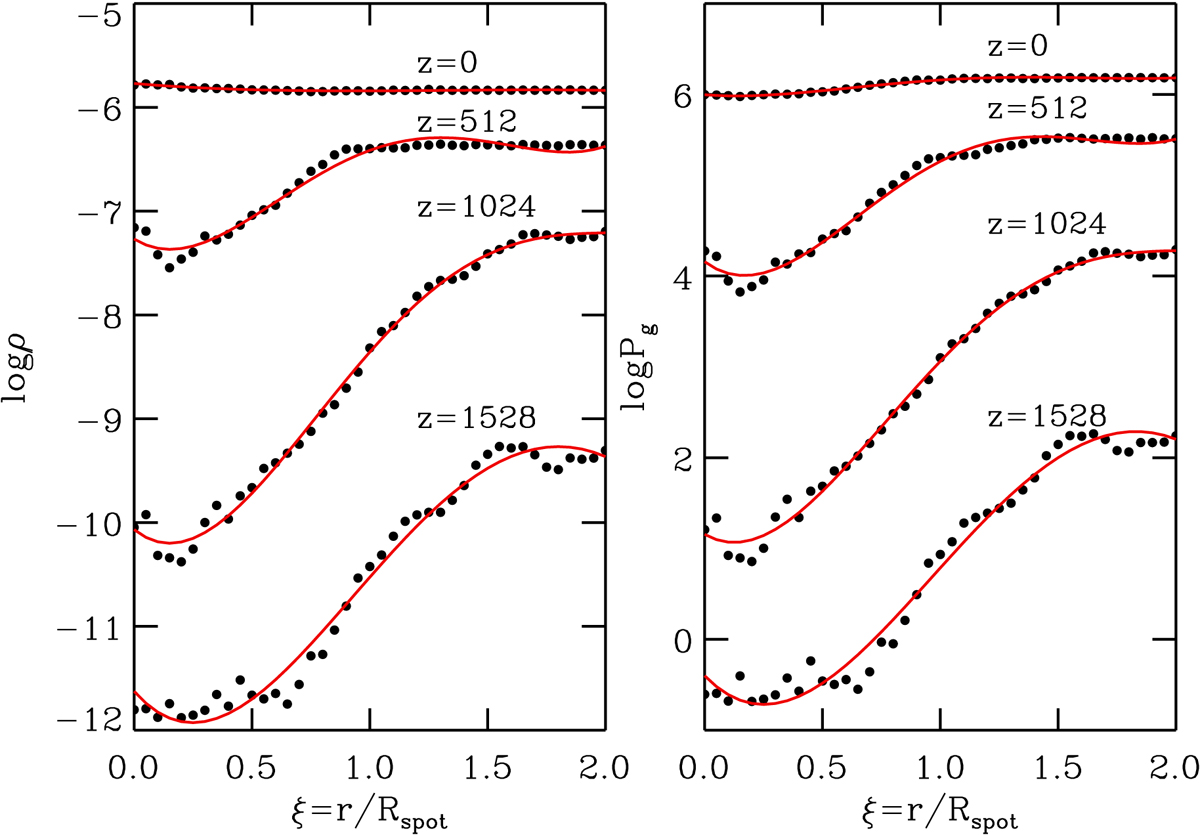
Logarithm of the density (left) and gas pressure (right) as a function of the normalized radial distance to the center of the sunspot ξ = r/Rspot at four different vertical heights z = 0, 512, 1024, 1528 km. Larger z values correspond to higher atmospheric layers. Black circles correspond to the azimuthal- or ϕ-averages of the MHD simulations (Sect. 2). Red curves are obtained through fourth-order polynomial approximations to the black circles.
Current usage metrics show cumulative count of Article Views (full-text article views including HTML views, PDF and ePub downloads, according to the available data) and Abstracts Views on Vision4Press platform.
Data correspond to usage on the plateform after 2015. The current usage metrics is available 48-96 hours after online publication and is updated daily on week days.
Initial download of the metrics may take a while.