Fig. 3.
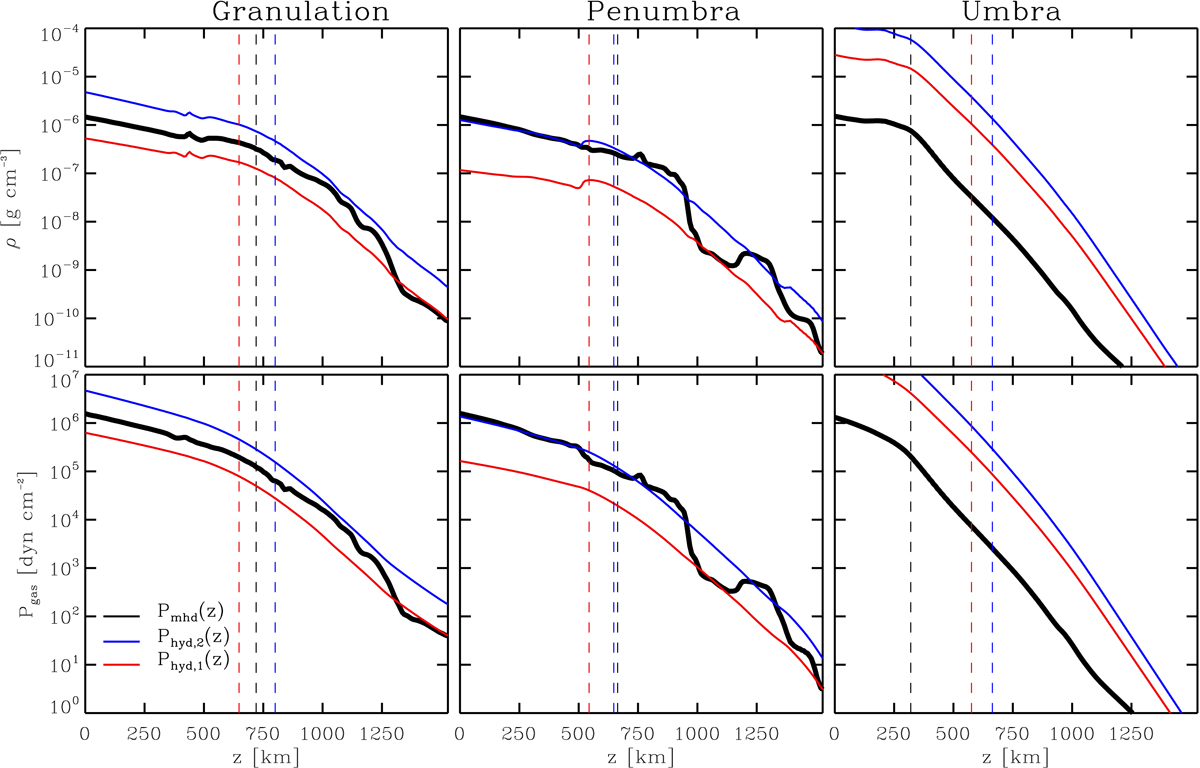
Top panels: density as a function of the geometrical height z (i.e., vertical coordinate) for three spatial (x, y) locations corresponding to the sunspot umbra (right), penumbra (middle), and surrounding granulation (left). These locations are indicated by white circles in Fig. 1. Bottom panels: same as top panels but for the gas pressure. Solid black curves correspond to the actual values from the three-dimensional MHD simulation (Sect. 2), whereas colored lines are the hydrostatic results using the two boundary conditions described in the text: Phyd, 1 (red) and Phyd, 2 (blue). The vertical dashed lines indicate the location of the z(τc = 1)-level (i.e., Wilson depression).
Current usage metrics show cumulative count of Article Views (full-text article views including HTML views, PDF and ePub downloads, according to the available data) and Abstracts Views on Vision4Press platform.
Data correspond to usage on the plateform after 2015. The current usage metrics is available 48-96 hours after online publication and is updated daily on week days.
Initial download of the metrics may take a while.