Open Access
Fig. 8
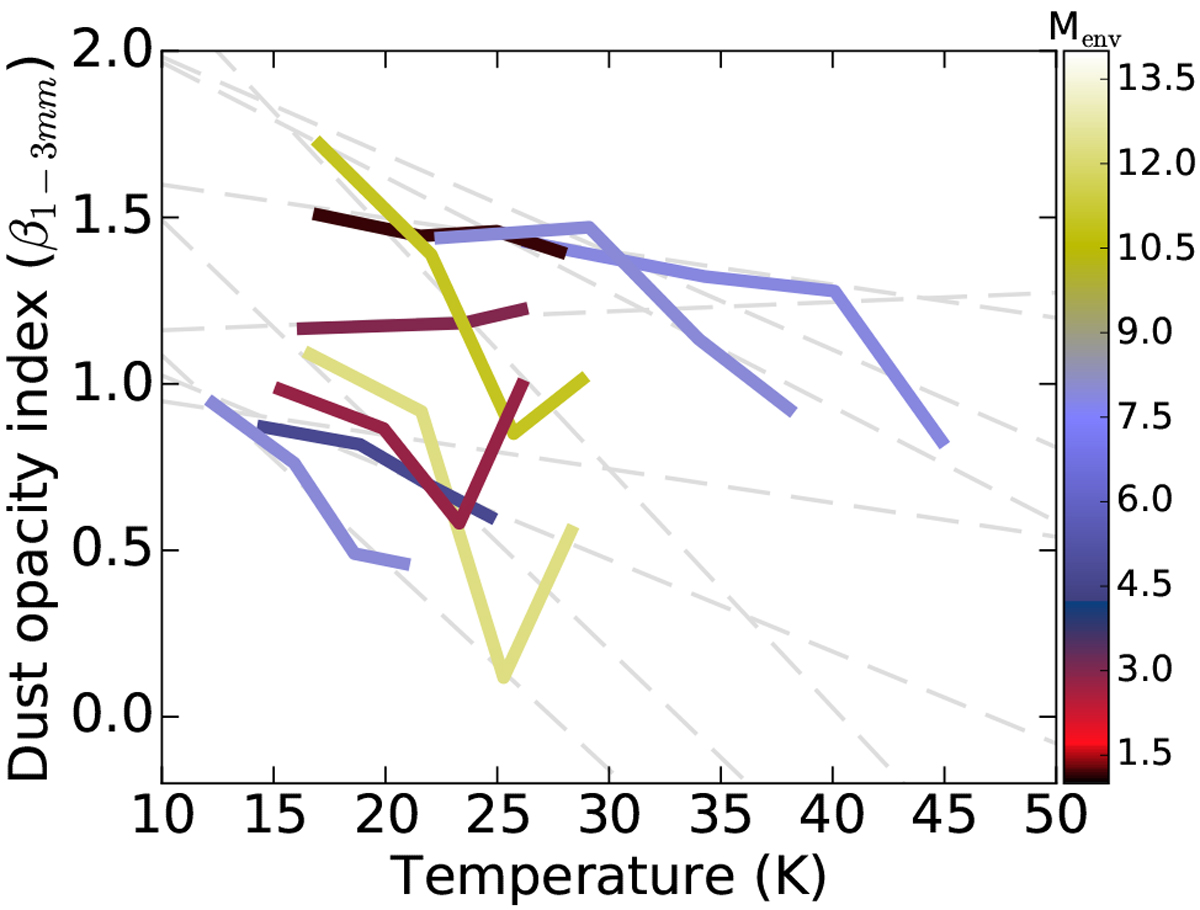
Local variation of the dust emissivity index β1−3mm as a function of the temperature in the envelope of each source. Lines are color coded depending on the source envelope mass. The dashed gray lines indicate the fit to the relation for each source to guide the eye.
Current usage metrics show cumulative count of Article Views (full-text article views including HTML views, PDF and ePub downloads, according to the available data) and Abstracts Views on Vision4Press platform.
Data correspond to usage on the plateform after 2015. The current usage metrics is available 48-96 hours after online publication and is updated daily on week days.
Initial download of the metrics may take a while.