Open Access
Fig. 6
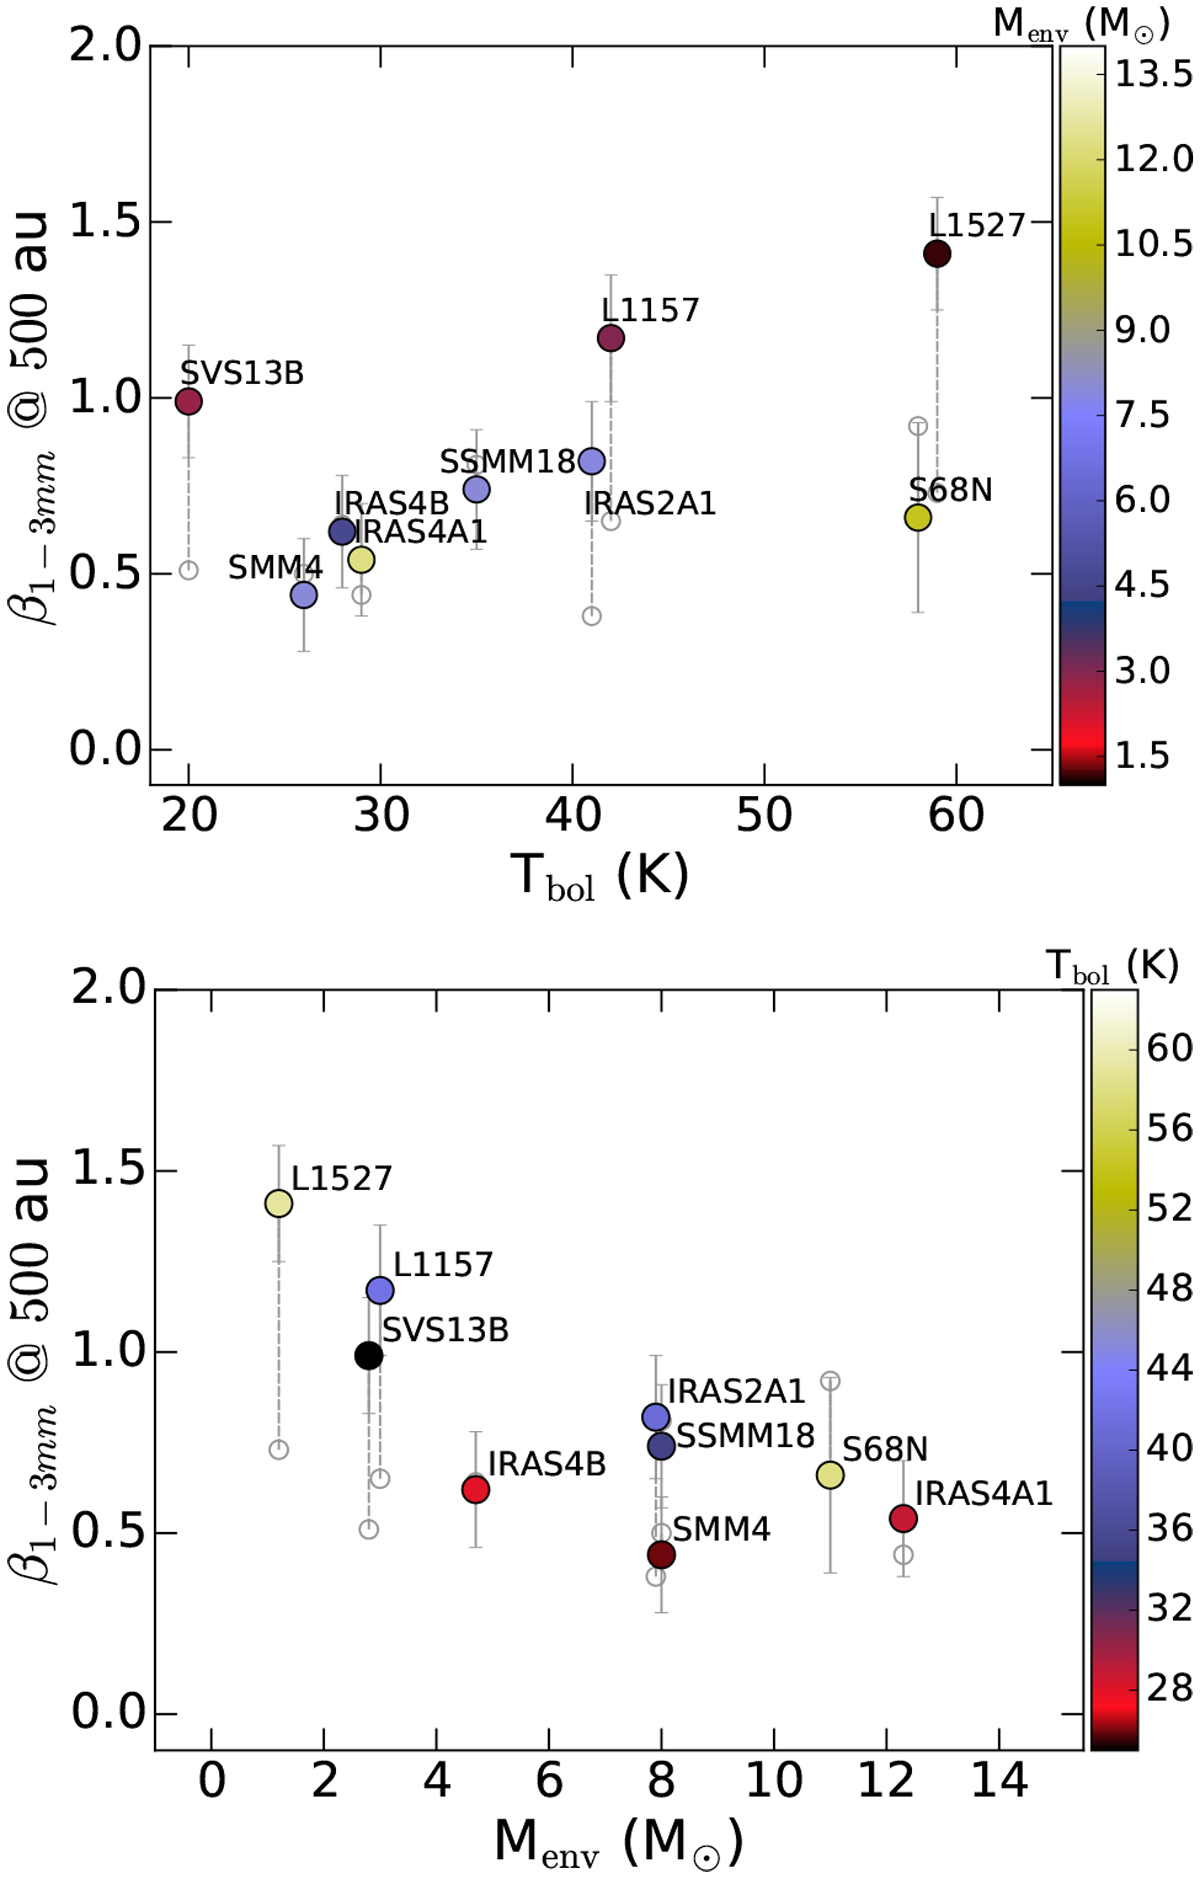
Relation between the β1−3mm value at 500 au and the bolometric temperature (top) and envelope mass (bottom). The β1−3mm values at 500 au are tabulated in Table 2. Colored/empty symbols represent the values after/before the central region correction (c.r.c).
Current usage metrics show cumulative count of Article Views (full-text article views including HTML views, PDF and ePub downloads, according to the available data) and Abstracts Views on Vision4Press platform.
Data correspond to usage on the plateform after 2015. The current usage metrics is available 48-96 hours after online publication and is updated daily on week days.
Initial download of the metrics may take a while.