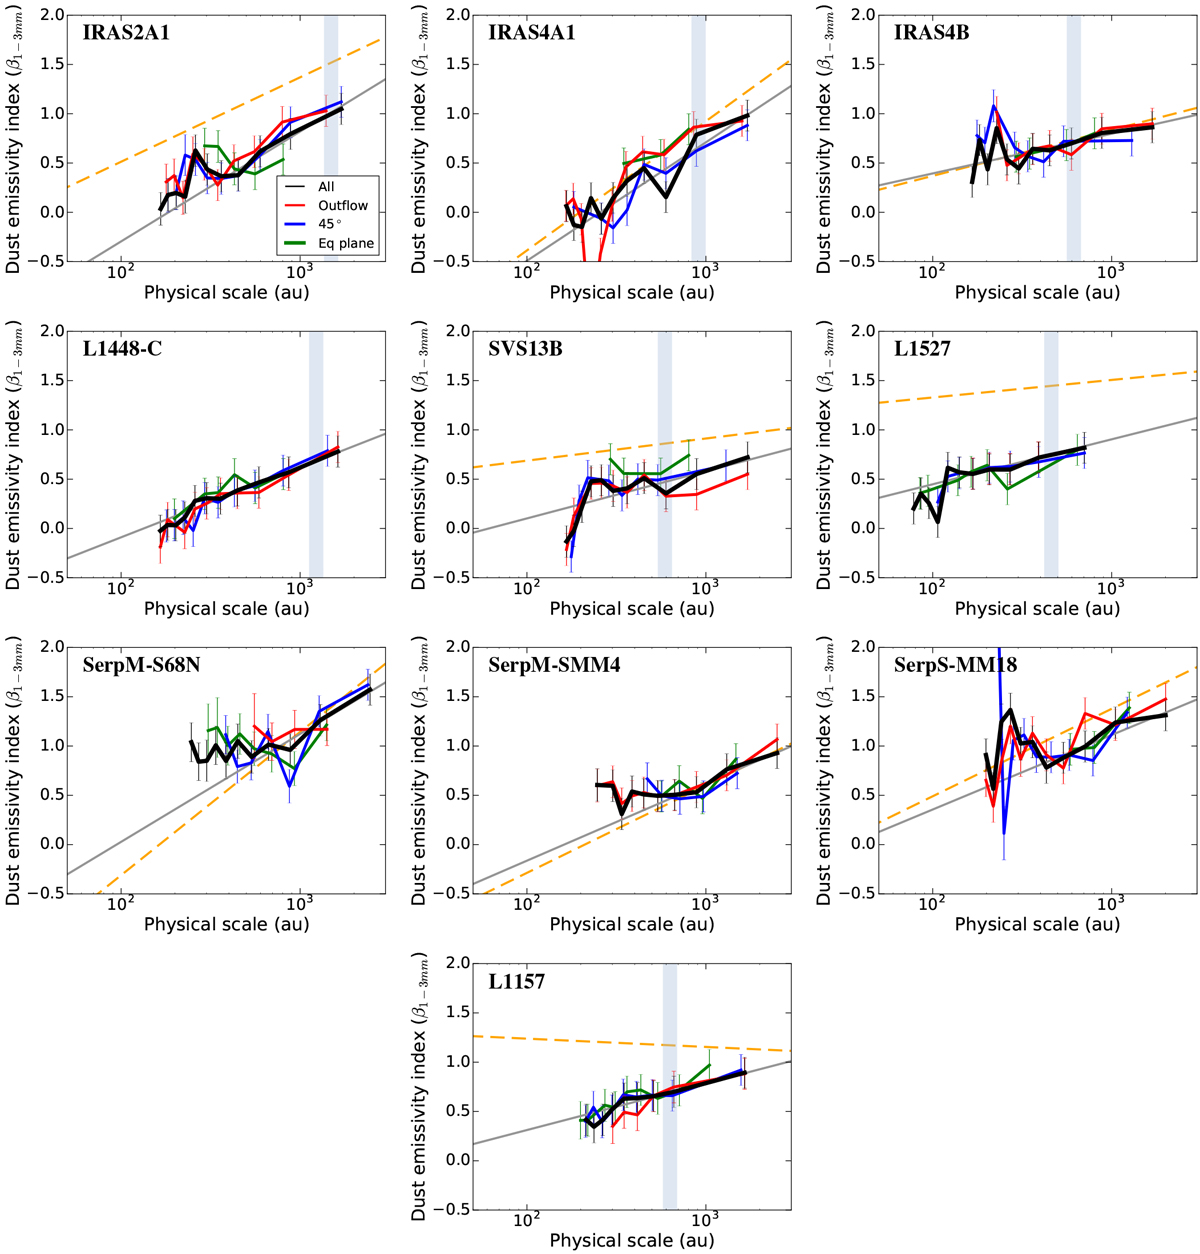
Fig. 5

Variation of the dust emissivity index β1−3mm as a function of the physical scale integrated in the protostellar envelope. The thick black line indicates the trend when all directions are considered while the gray line indicates the (log-lin) fit to the trend (see Table 2). The colored lines indicate the trend in various angular bins with respect to the outflow direction. If PA is the position angle with respect to the outflow axis, the red lines indicate the trends for regions located close to the outflow direction (−22.5° < PA < 22.5°). The blue lines indicate the trends for regions located close to the 45° PA (22.5° < PA < 67.5° and −67.5° < PA < 22.5°). The green lines indicate the trends for regions located close to the equatorial plane (67.5° <PA < 122.5°). The orange dotted line indicates the fit to the β1−3 mm values corrected for the central region (see Sect. 4). We do not apply the correctionfor L1448-C, as its 3 mm flux is dominated at most scales by the compact component, with barely any flux coming from the envelope, leading to large uncertainties in the β1−3 mm determination. Finally, the light blue shaded line indicates the position of the CO snow line determined from the N2 H+ and C18 O observations(Gaudel et al. 2019; Anderl et al. 2016).
Current usage metrics show cumulative count of Article Views (full-text article views including HTML views, PDF and ePub downloads, according to the available data) and Abstracts Views on Vision4Press platform.
Data correspond to usage on the plateform after 2015. The current usage metrics is available 48-96 hours after online publication and is updated daily on week days.
Initial download of the metrics may take a while.


