Fig. 4
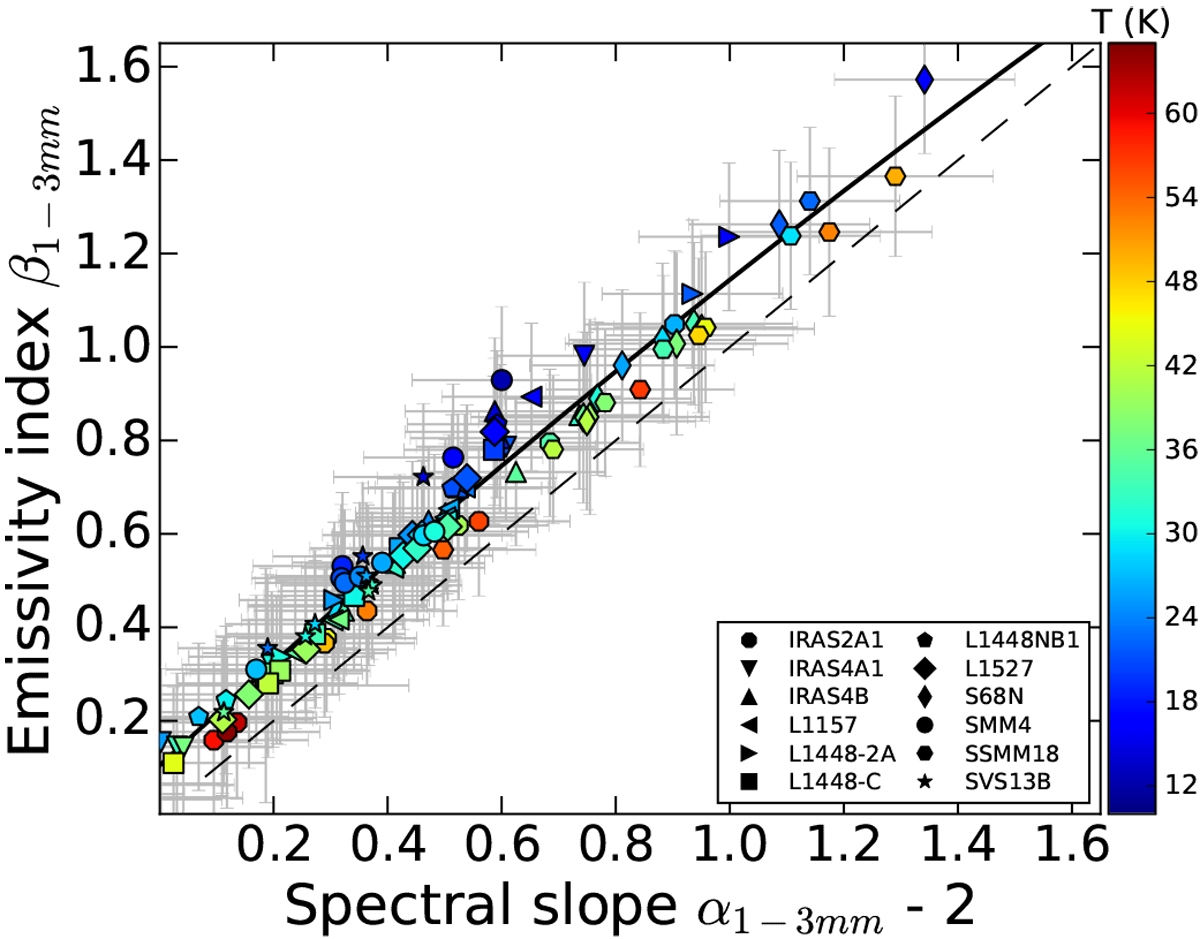
Relation between the dust emissivity index β1−3mm and the observed spectral index α1−3mm-2. The dashed line represents the 1:1 relation, while the plain line represents the polynomial regression to the data (β1−3mm = −0.07 (α1−3mm − 2)2 + 1.12 (α1−3mm − 2) + 0.10). Each symbol represents a different protostellar envelope and symbols are color coded with respect to our modeled dust temperature.
Current usage metrics show cumulative count of Article Views (full-text article views including HTML views, PDF and ePub downloads, according to the available data) and Abstracts Views on Vision4Press platform.
Data correspond to usage on the plateform after 2015. The current usage metrics is available 48-96 hours after online publication and is updated daily on week days.
Initial download of the metrics may take a while.