Fig. 3
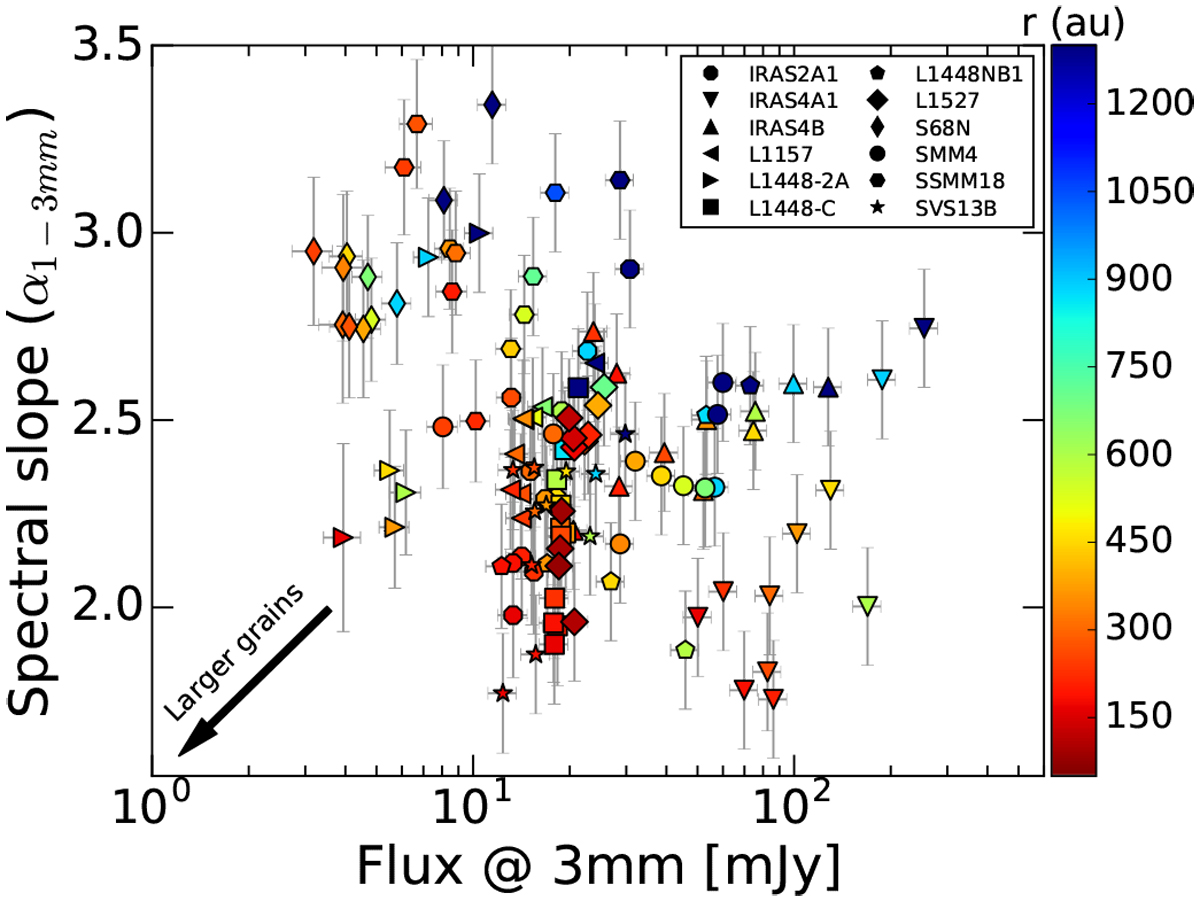
Variation of the observed spectral index α1−3mm derived in the baseline bins of Fig. 1 as a function of its associated 3.2 mm flux density. Each symbol represents adifferent protostellar envelope and symbols are color coded with respect to the physical distances probed (in au). Thebottom left arrow indicates the trend predicted when the grain size is increasing (see models from Miotello et al. 2014).
Current usage metrics show cumulative count of Article Views (full-text article views including HTML views, PDF and ePub downloads, according to the available data) and Abstracts Views on Vision4Press platform.
Data correspond to usage on the plateform after 2015. The current usage metrics is available 48-96 hours after online publication and is updated daily on week days.
Initial download of the metrics may take a while.