Fig. C.1
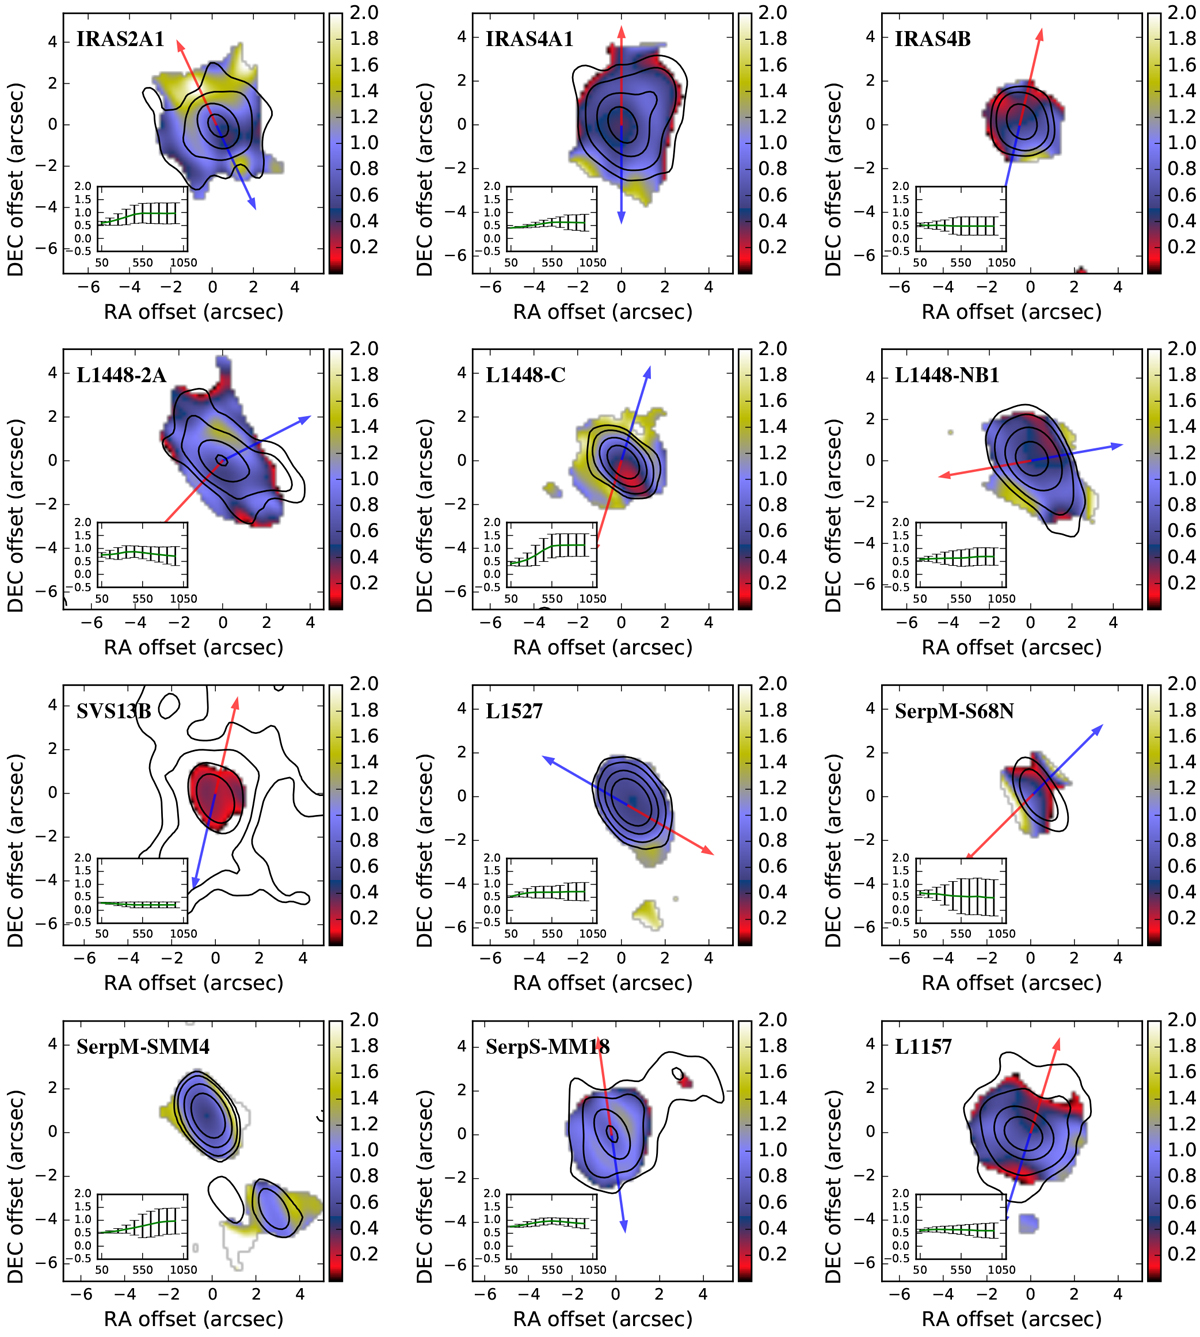
Maps of the dust emissivity index β1−3mm. Only pixels with a 2σ detection at both wavelengths are shown. The contours indicate the 94 GHz emission detected at 3, 5, 10, 30, and 80σ. The blue and red arrows indicate the direction of the bipolar jets. The insets show how β1−3mm evolves as values get integrated to larger and larger scales. The x-axis of the inset plots is labeled in astronomical units.
Current usage metrics show cumulative count of Article Views (full-text article views including HTML views, PDF and ePub downloads, according to the available data) and Abstracts Views on Vision4Press platform.
Data correspond to usage on the plateform after 2015. The current usage metrics is available 48-96 hours after online publication and is updated daily on week days.
Initial download of the metrics may take a while.