Fig. B.2
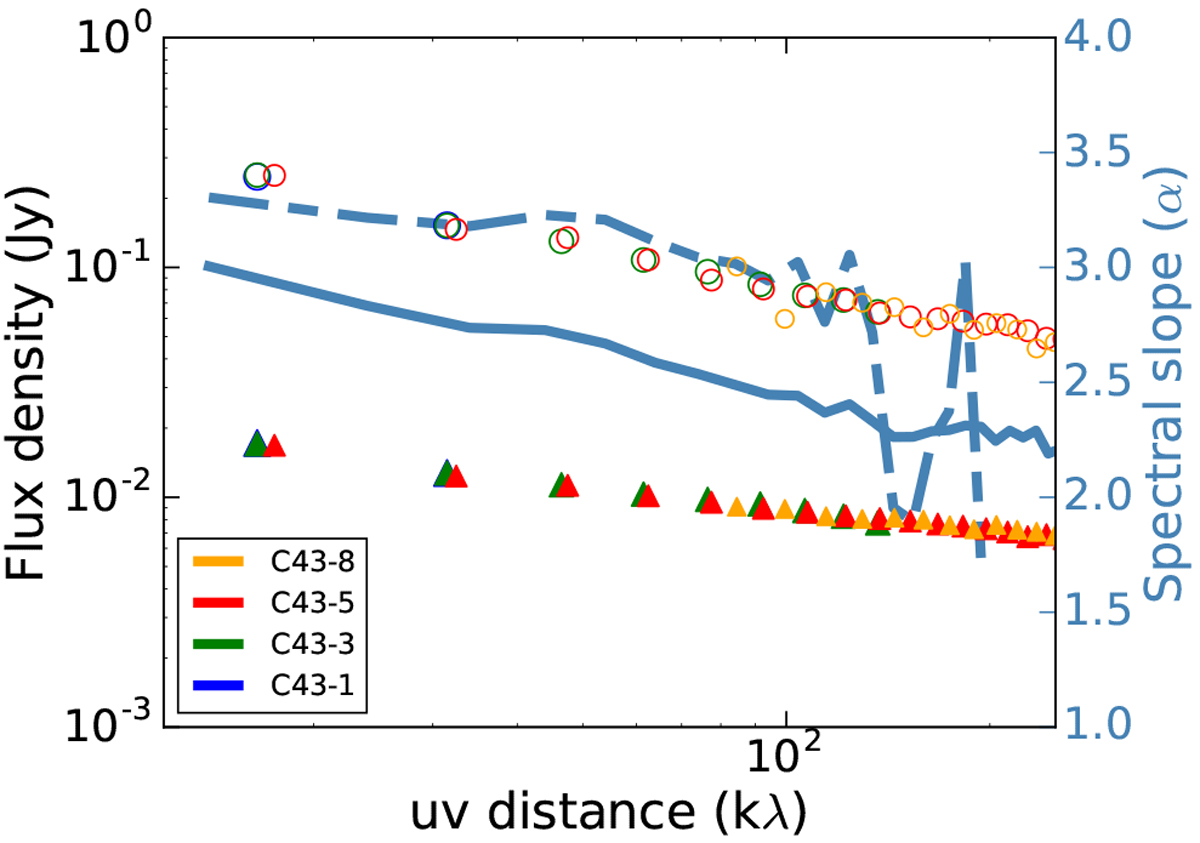
Predicted flux density of the dust continuum at 1.3 mm (open circles) and 3.2 mm (filled triangles) as a function of the uv distance averaged every 25 kλ for different ALMA antenna configurations. The corresponding spectral index α is shown with the blue line. Values are given on the right y-axis. The dashed blue line indicates α values corrected for the central regions (average flux around 200 kλ removed).
Current usage metrics show cumulative count of Article Views (full-text article views including HTML views, PDF and ePub downloads, according to the available data) and Abstracts Views on Vision4Press platform.
Data correspond to usage on the plateform after 2015. The current usage metrics is available 48-96 hours after online publication and is updated daily on week days.
Initial download of the metrics may take a while.