Fig. 1
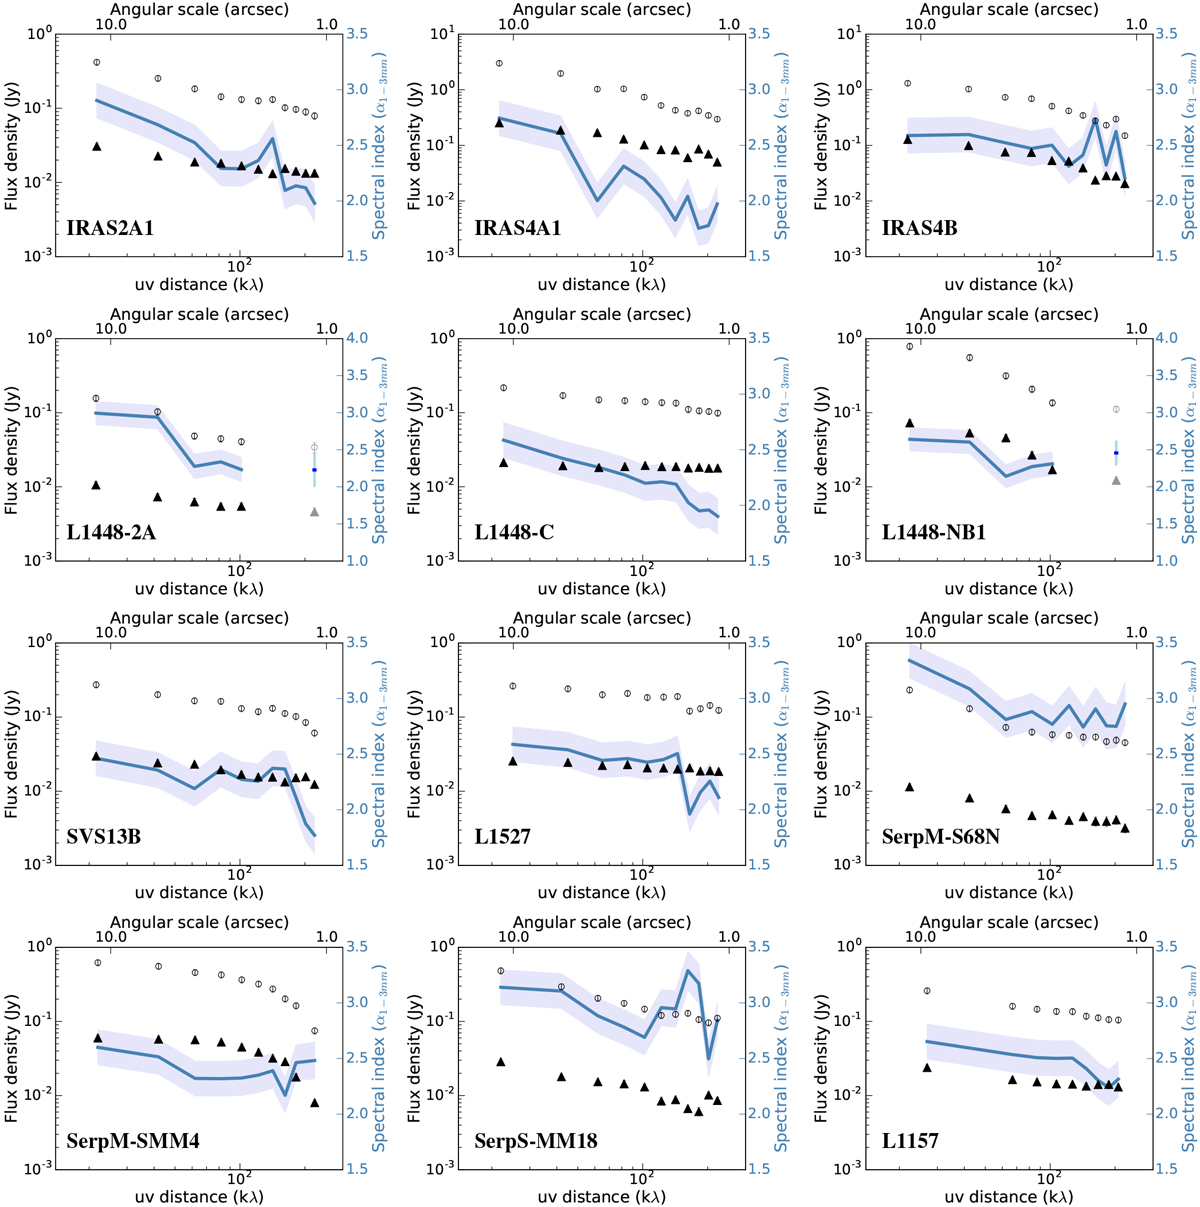
Continuum flux density at 1.3 (open circles) and 3.2 mm (filled triangles) as a function of the baselines averaged every 20 kλ. The variations of the observed spectral index α1−3mm (see Eq. (2)) are overlaid (blue line). Their values are shown on the right y-axis. The error bars indicate the flux uncertainties and include the calibration errors. These errors are used to derive the uncertainties on α1−3mm shown as the shaded blue area. As L1448-N and L1448-2A host a secondary source, we only show the continuum flux densities at the shortest baselines but also indicate the flux at ~200 kλ obtained using the primary source as the phase center (see Sect. 2.2 for more details).
Current usage metrics show cumulative count of Article Views (full-text article views including HTML views, PDF and ePub downloads, according to the available data) and Abstracts Views on Vision4Press platform.
Data correspond to usage on the plateform after 2015. The current usage metrics is available 48-96 hours after online publication and is updated daily on week days.
Initial download of the metrics may take a while.