Free Access
Fig. 9
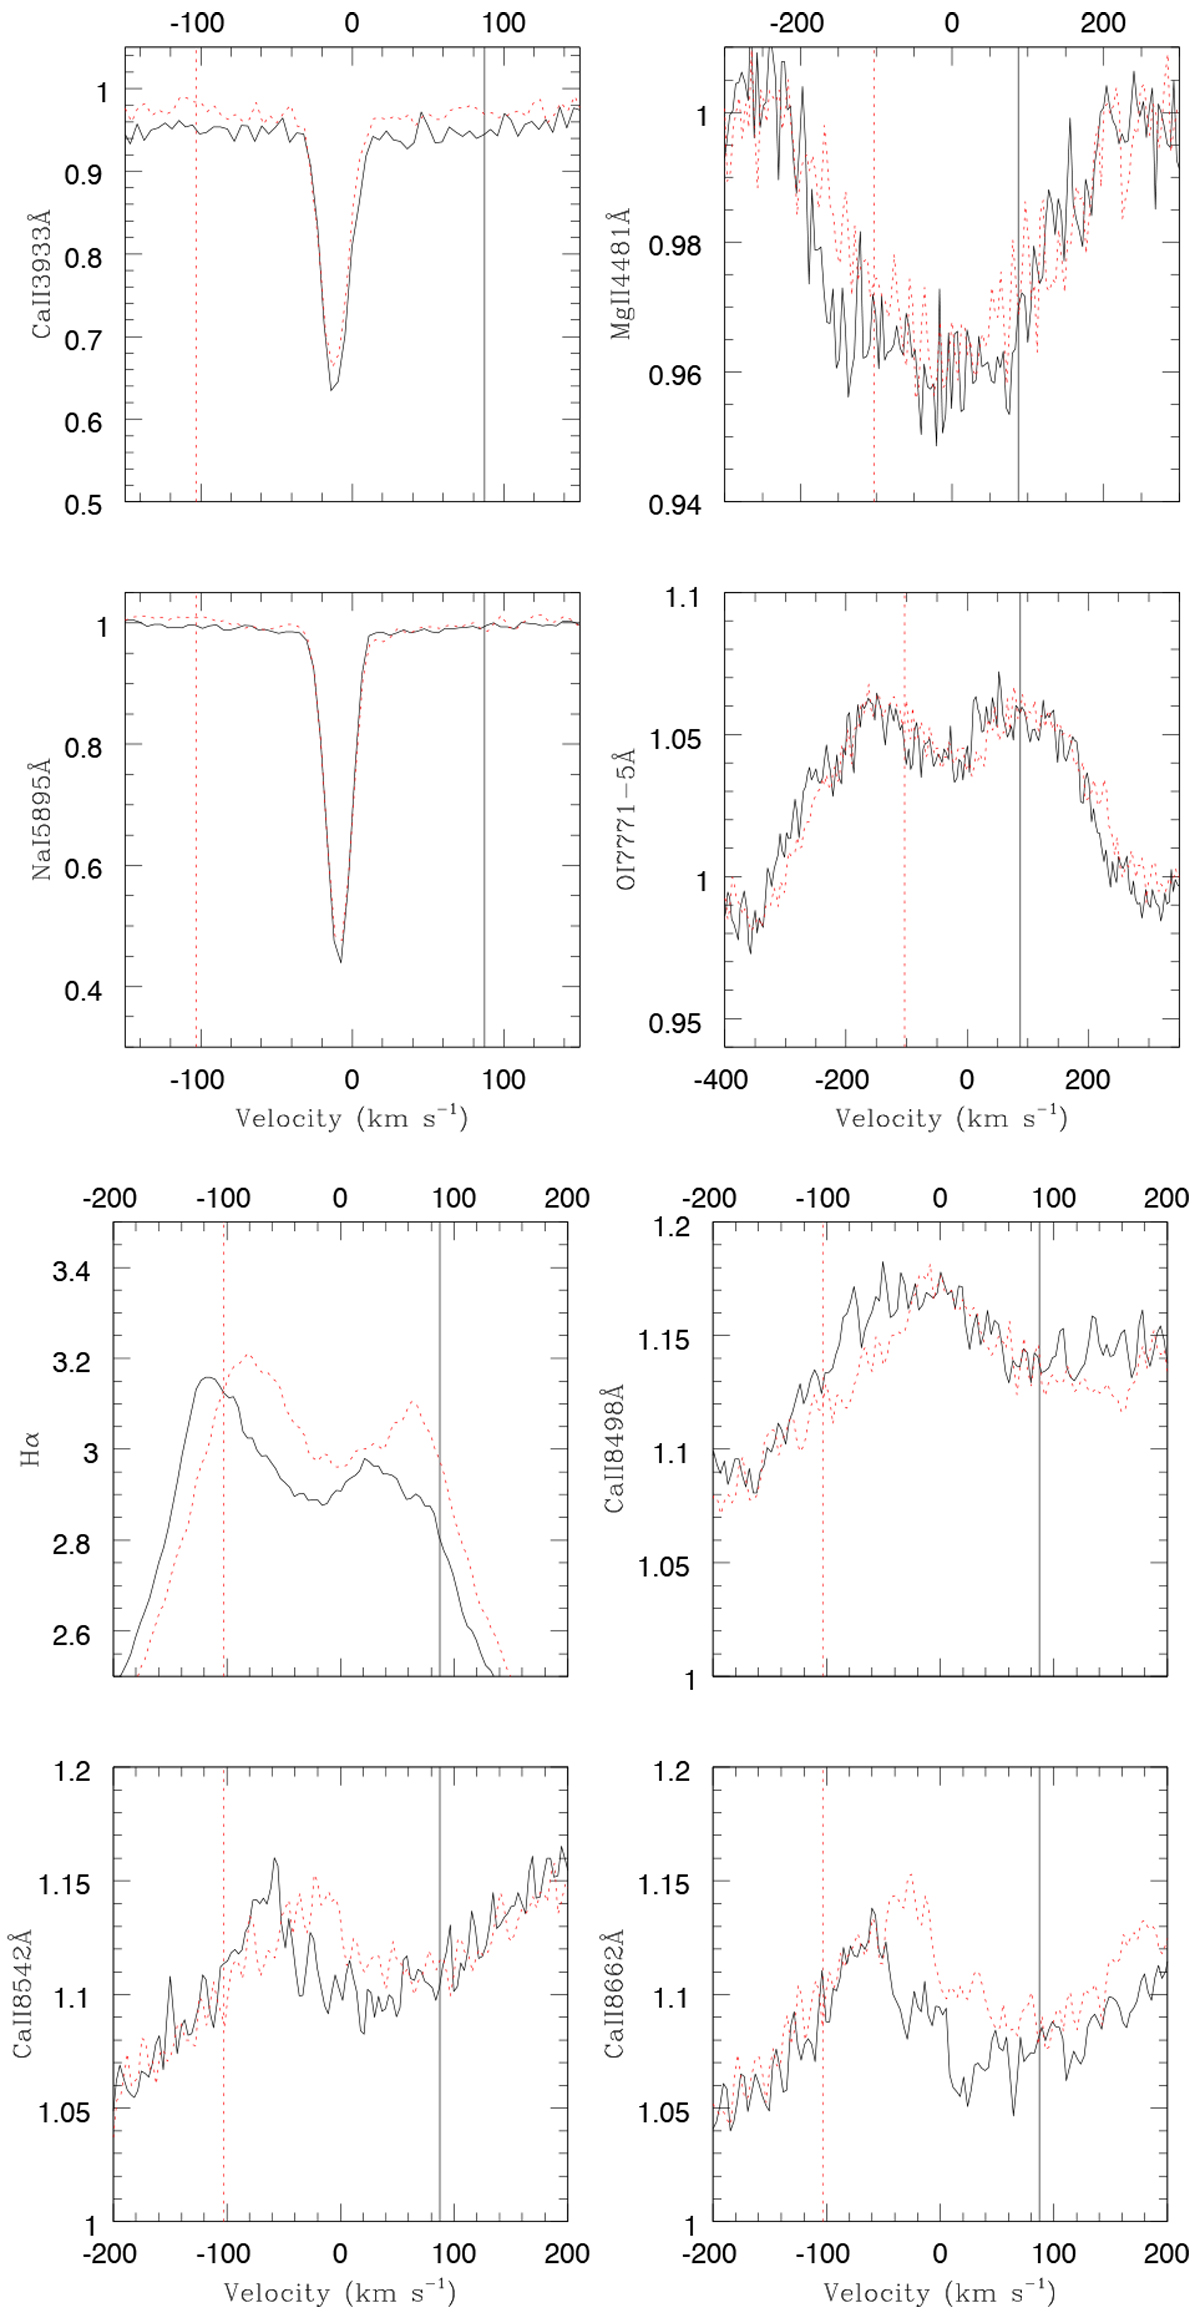
Comparison of spectra taken at two different phases (25 August 2018, ϕ = 0.08, shown as thesolid black line, and 29 September 2018, ϕ = 0.50, shown as the red dotted line) around selected lines. The vertical lines indicate the expected companion velocity for the orbital solution of Bjorkman et al. (2002).
Current usage metrics show cumulative count of Article Views (full-text article views including HTML views, PDF and ePub downloads, according to the available data) and Abstracts Views on Vision4Press platform.
Data correspond to usage on the plateform after 2015. The current usage metrics is available 48-96 hours after online publication and is updated daily on week days.
Initial download of the metrics may take a while.