Free Access
Fig. 2
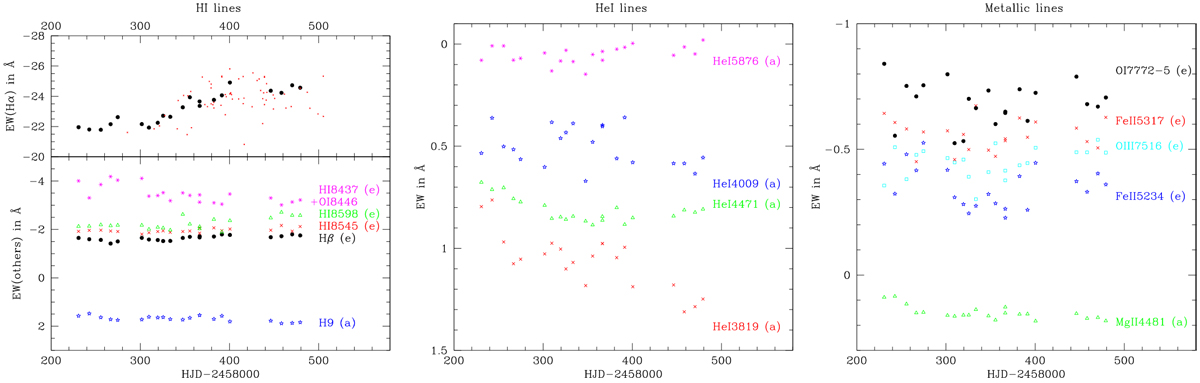
Evolution with time of zeroth-order moments (EWs) for hydrogen, He I, and metallic lines. In these panels, higher emissions (absorptions) are toward the top (bottom). For Hα, the values derived from amateur data reported by Nazé et al. (2019) are also shown as small red crosses.
Current usage metrics show cumulative count of Article Views (full-text article views including HTML views, PDF and ePub downloads, according to the available data) and Abstracts Views on Vision4Press platform.
Data correspond to usage on the plateform after 2015. The current usage metrics is available 48-96 hours after online publication and is updated daily on week days.
Initial download of the metrics may take a while.