Fig. 13
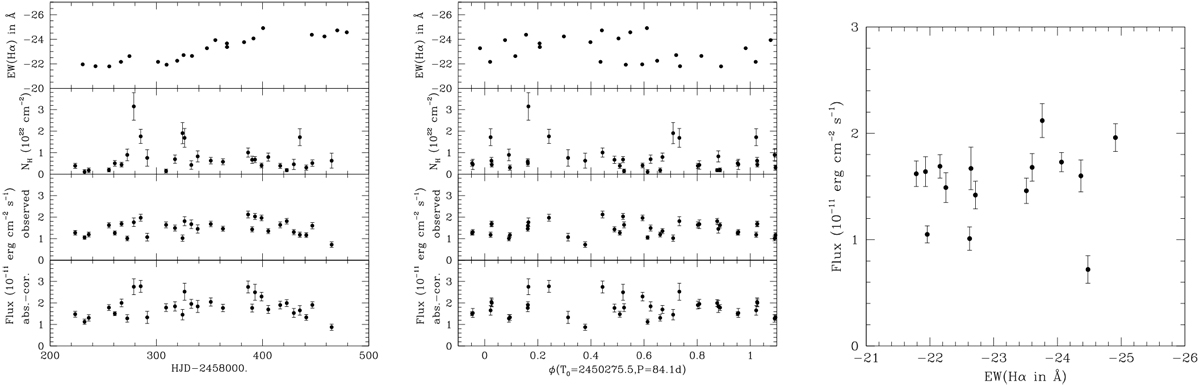
Evolution with time (left) or orbital phase (middle, using an average ephemeris from Bjorkman et al. 2002) of the X-ray fluxes, best-fit local absorbing columns, and EWs of Hα in 2018 for π Aqr. The right panel directly compares the EW of Hα measured on TIGRE spectra and the observed X-ray flux of the closest Swift exposure(s).
Current usage metrics show cumulative count of Article Views (full-text article views including HTML views, PDF and ePub downloads, according to the available data) and Abstracts Views on Vision4Press platform.
Data correspond to usage on the plateform after 2015. The current usage metrics is available 48-96 hours after online publication and is updated daily on week days.
Initial download of the metrics may take a while.