Fig. 10
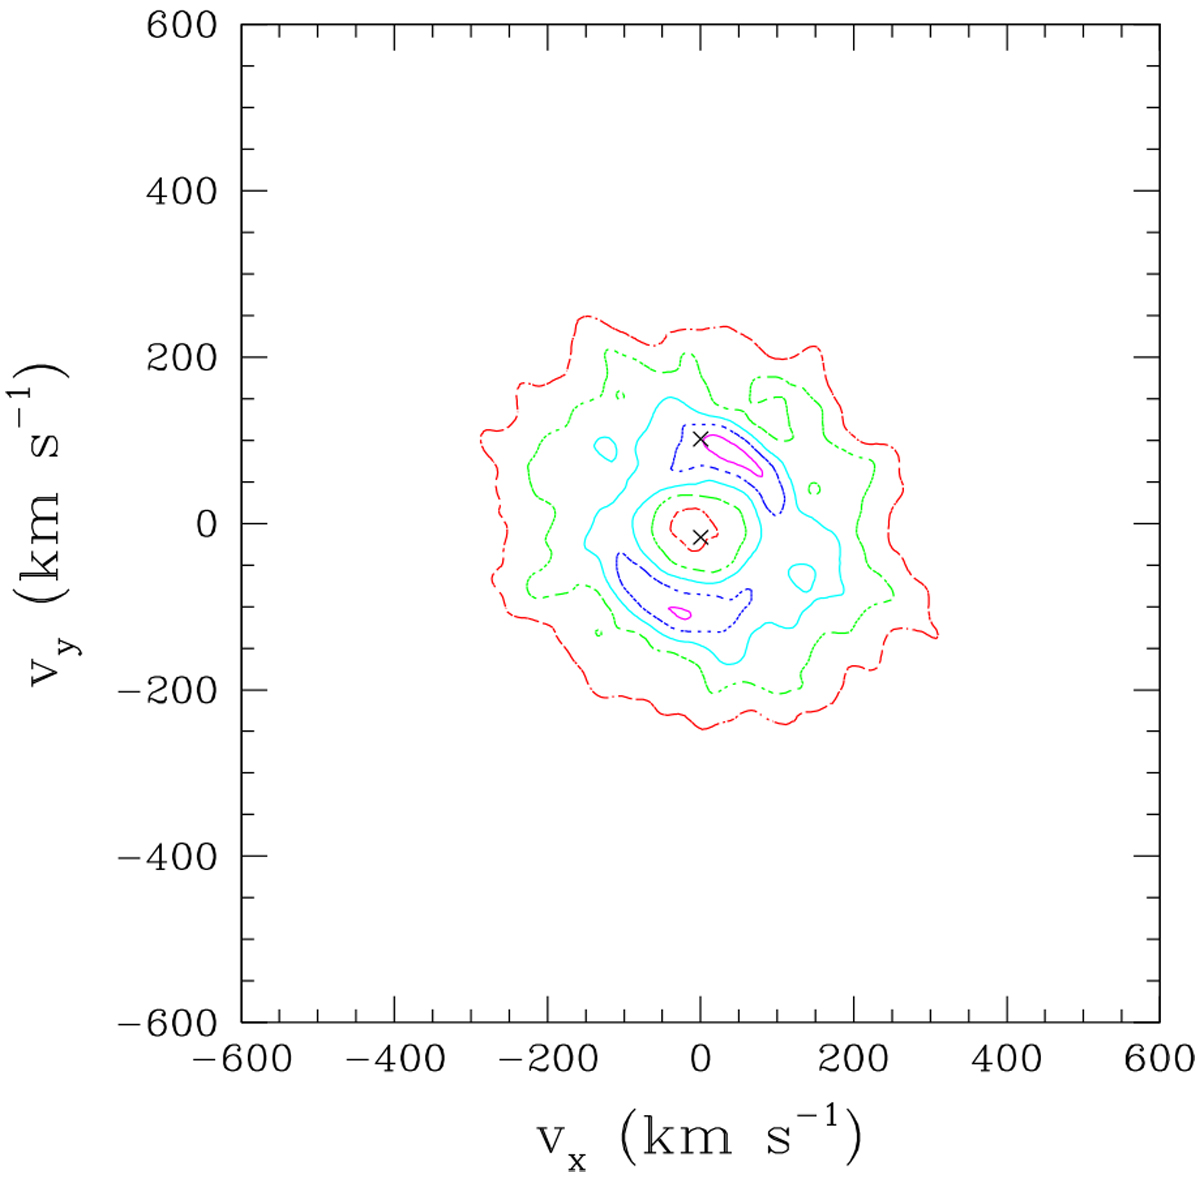
Doppler map for Hα in 2018. The magenta, blue, cyan, green, and red contours correspond to amplitudes of 95, 80, 65, 50, and 35% of the maximum intensity. The two crosses indicate the velocities of the secondary (top) and primary (bottom) according to the semi-amplitudes K derived by Bjorkman et al. (2002). The maps correspond to a slice at vz = − 10 km s−1, the mean value in RV of the system; values of +10 or 0 km s−1 provide similar results, however.
Current usage metrics show cumulative count of Article Views (full-text article views including HTML views, PDF and ePub downloads, according to the available data) and Abstracts Views on Vision4Press platform.
Data correspond to usage on the plateform after 2015. The current usage metrics is available 48-96 hours after online publication and is updated daily on week days.
Initial download of the metrics may take a while.