Fig. 2
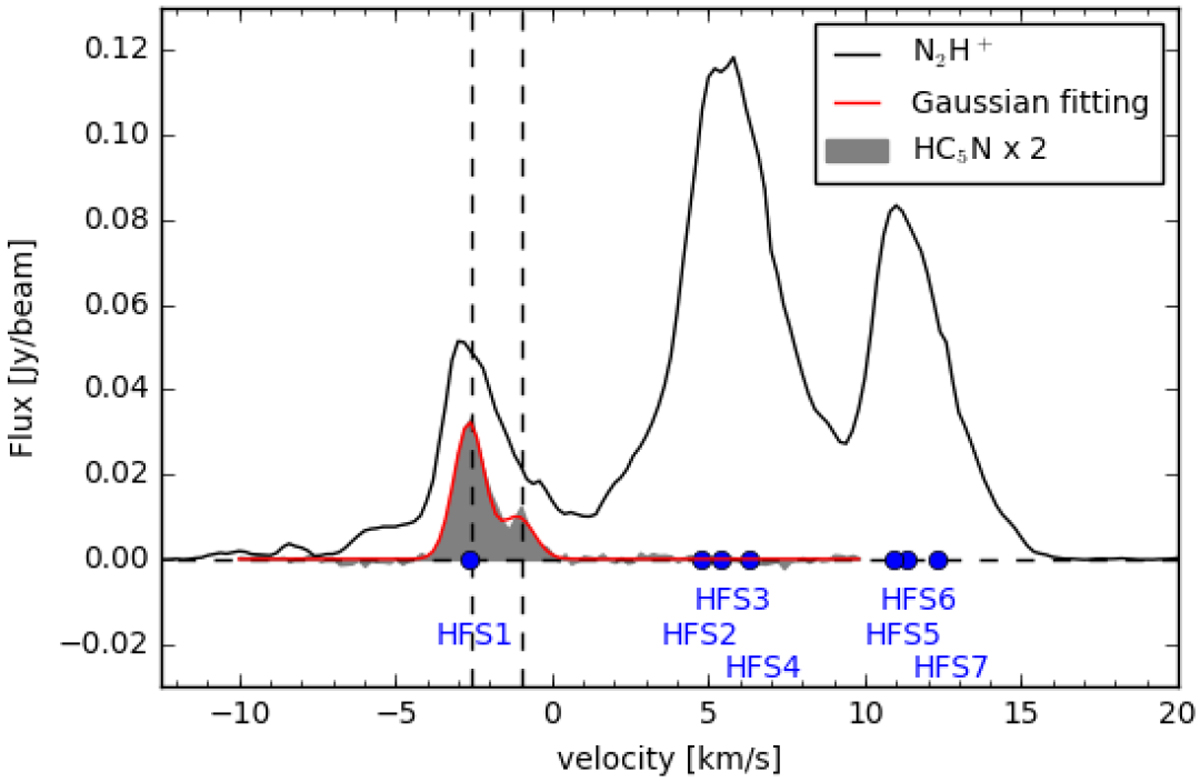
N2H+(1–0) (black) and HC5N(36–35) (gray) spectra averaged over pixels where the emission was detected above 5 σ. The red curve shows a two-component Gaussian fit to the HC5N line profile. The blue circles indicate the peak velocity positions of each N2H+(1–0) HFS component expected from the HC5N(36–35) systemic velocity of −2.6 km s−1. The vertical dashed lines mark the peaks of the two HC5N velocity components.
Current usage metrics show cumulative count of Article Views (full-text article views including HTML views, PDF and ePub downloads, according to the available data) and Abstracts Views on Vision4Press platform.
Data correspond to usage on the plateform after 2015. The current usage metrics is available 48-96 hours after online publication and is updated daily on week days.
Initial download of the metrics may take a while.