Fig. 5.
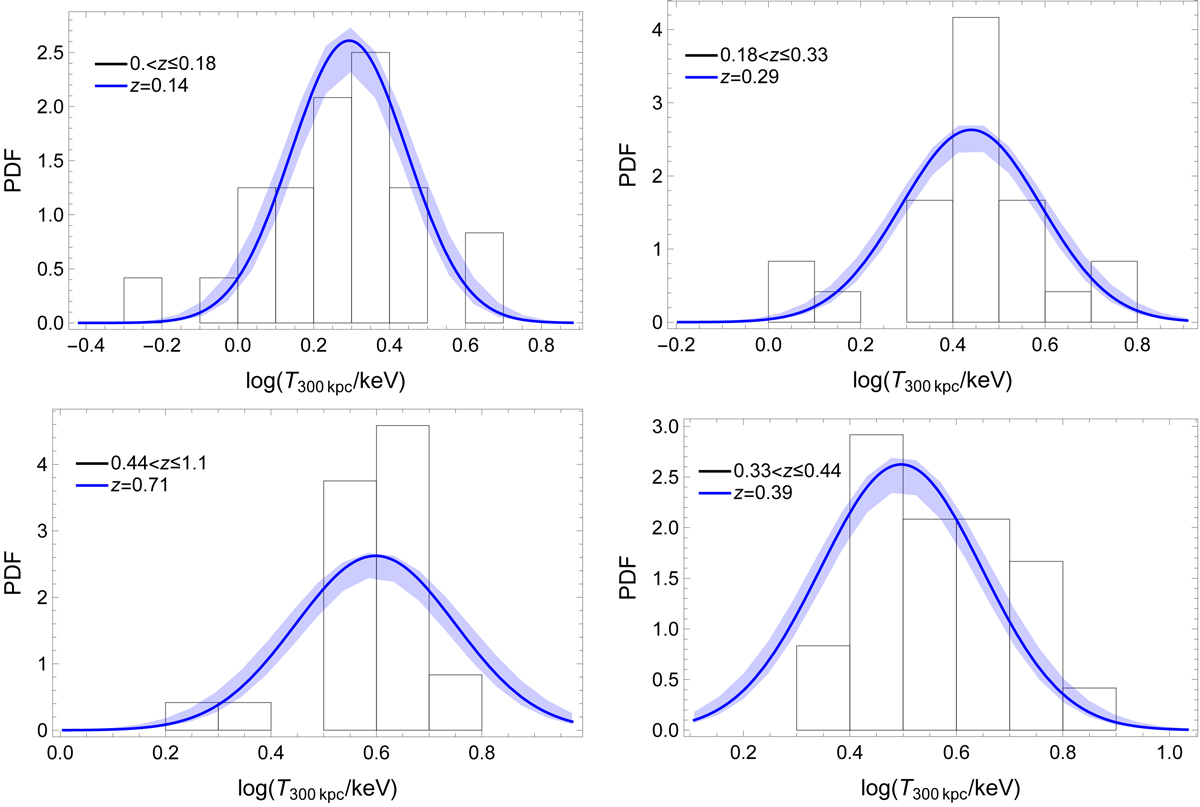
Temperature function of the clusters from the l − t analysis in four redshift bins. The black histogram groups the observed temperatures. The blue line is the normal approximation estimated from the regression at the median redshift in the bin. The shaded blue region encloses the 68.3% probability region around the median relation due to uncertainties on the parameters. The function for the observed temperatures is estimated from the regression output, i.e. the function of the unscattered temperatures, by smoothing the prediction with a Gaussian whose variance is given by the quadratic sum of the intrinsic scatter of the (logarithmic) temperature with respect to the unscattered temperature and the median observational uncertainty. Redshift increases clockwise from the top left to the bottom left panel. The median and the boundaries of the redshift bins are indicated in the legends of the respective panels.
Current usage metrics show cumulative count of Article Views (full-text article views including HTML views, PDF and ePub downloads, according to the available data) and Abstracts Views on Vision4Press platform.
Data correspond to usage on the plateform after 2015. The current usage metrics is available 48-96 hours after online publication and is updated daily on week days.
Initial download of the metrics may take a while.