Fig. 4.
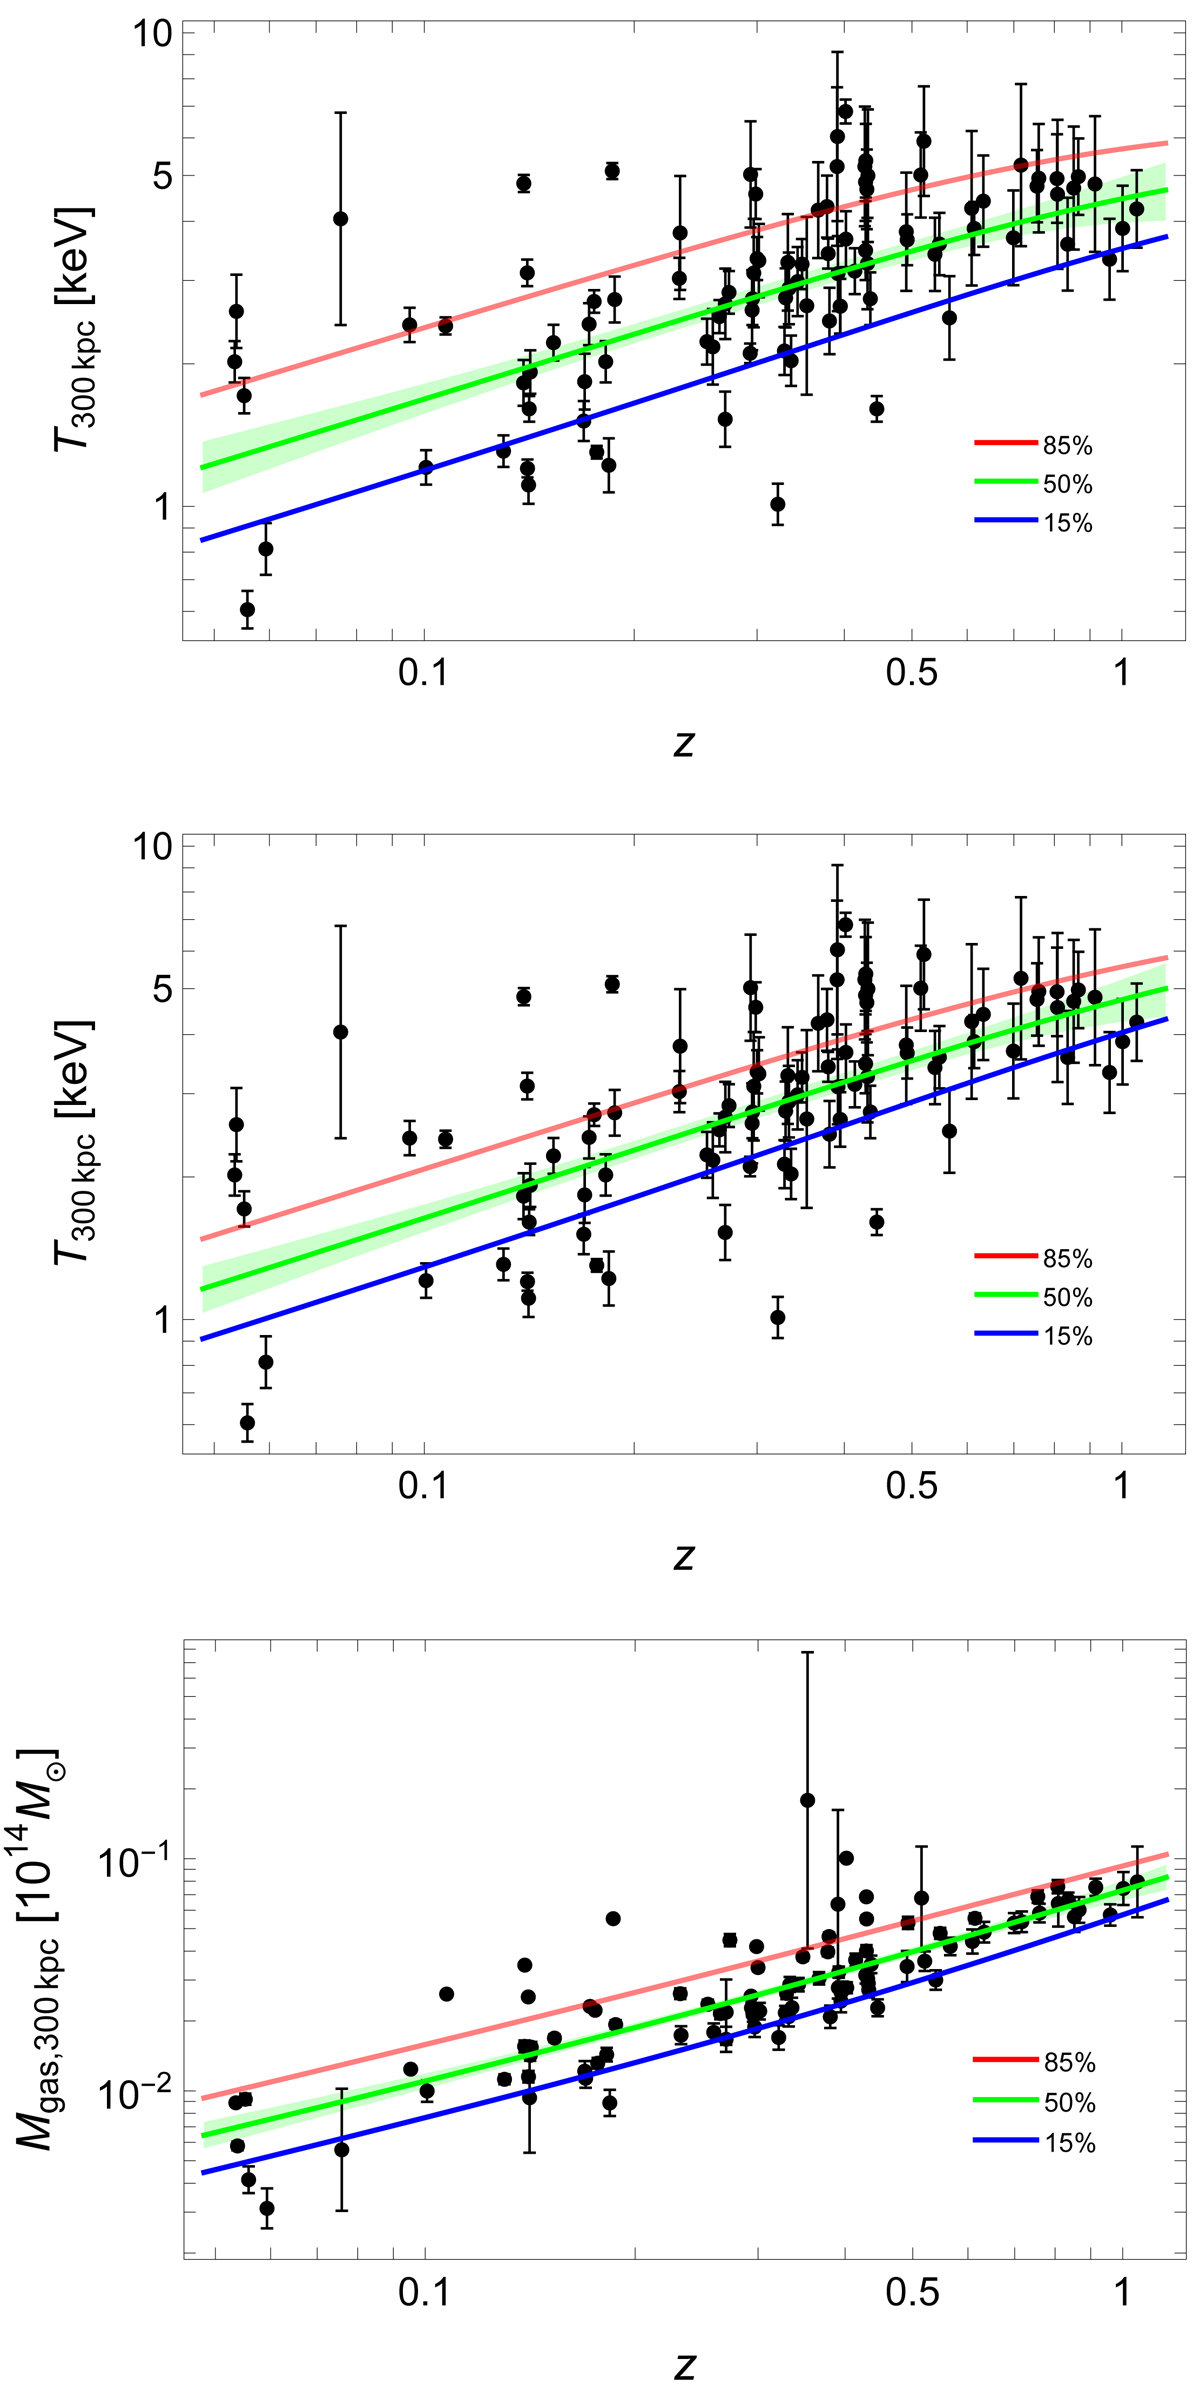
Time dependence of the X-ray observables of the selected clusters. Measured values are shown as a function of redshift (black points). The full lines plot the value of the unscattered observable below which a given fraction of the selected sample is contained. From top to bottom, the red, green, and blue lines show the 85%, 50%, and 15% levels (μZ), respectively. The shaded green region encloses the 68.3% confidence region around μZ(z) due to uncertainties on the parameters. Top panel: time dependence of the temperatures as inferred from the l − t relation. Temperatures are in units of keV. Middle panel: time dependence of the distribution of temperatures of the selected clusters as inferred from the mg − t relation. Bottom panel: time dependence of the distribution of gas masses of the selected clusters as inferred from the l − mg relation. Masses are in units of 1014 M⊙.
Current usage metrics show cumulative count of Article Views (full-text article views including HTML views, PDF and ePub downloads, according to the available data) and Abstracts Views on Vision4Press platform.
Data correspond to usage on the plateform after 2015. The current usage metrics is available 48-96 hours after online publication and is updated daily on week days.
Initial download of the metrics may take a while.