Fig. 3.
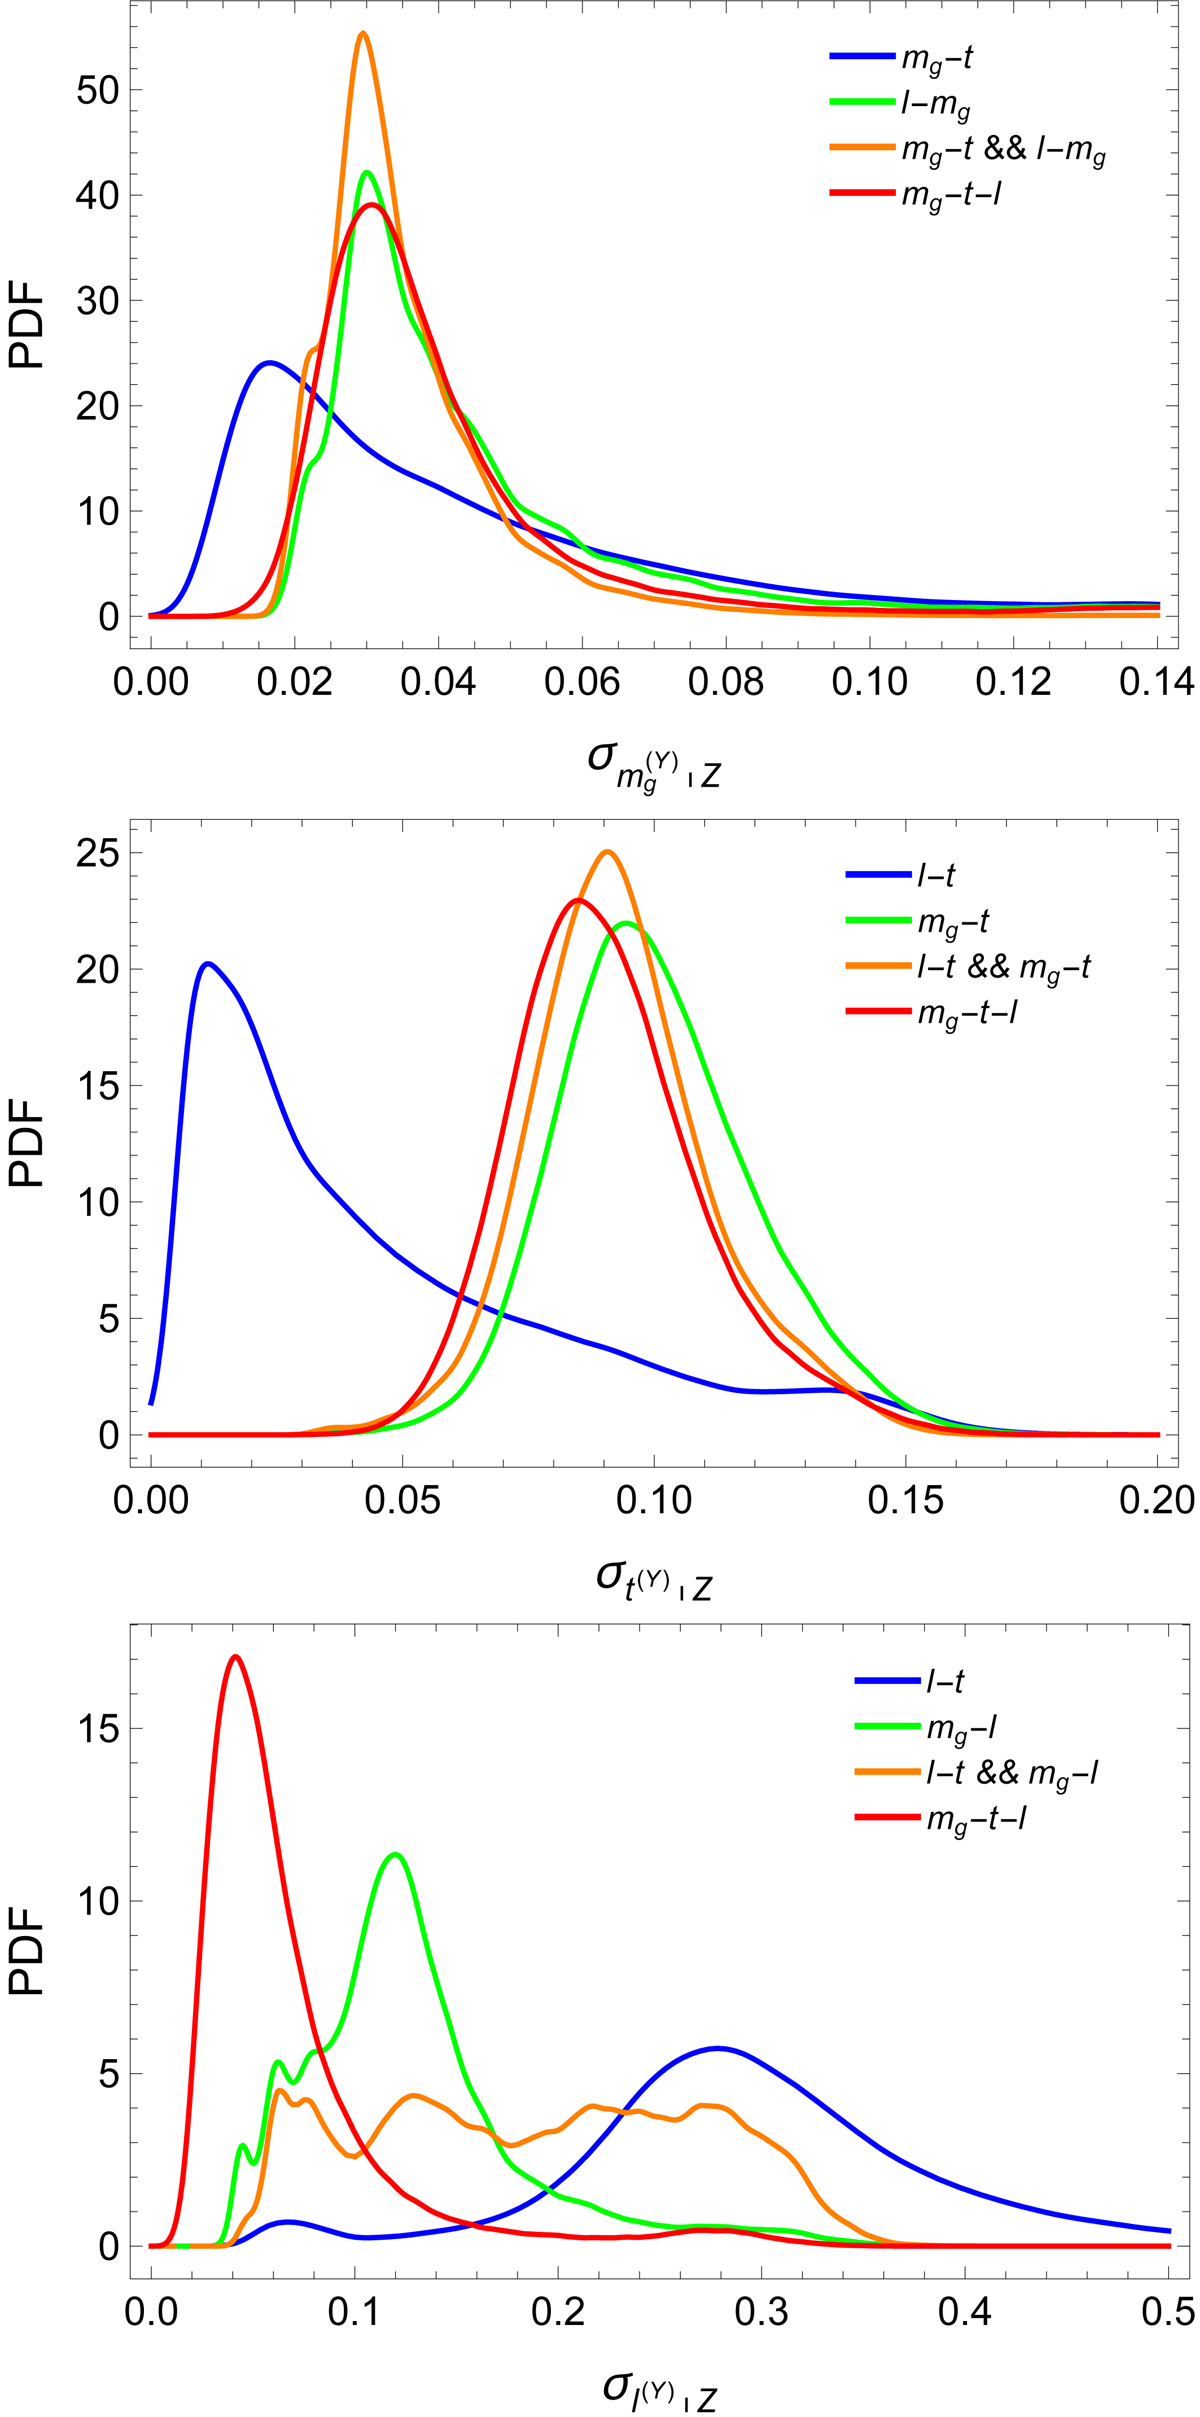
Inferred probability density functions of the conditional intrinsic scatter with respect to the mass substitute. The blue and the green lines show the results based on the fits of pairs; the orange and the red lines show the densities obtained with the joint analysis of pair fits and with the multi-response regression, respectively. Top panel: gas mass intrinsic scatter. Middle panel: temperature intrinsic scatter. Bottom panel: luminosity intrinsic scatter.
Current usage metrics show cumulative count of Article Views (full-text article views including HTML views, PDF and ePub downloads, according to the available data) and Abstracts Views on Vision4Press platform.
Data correspond to usage on the plateform after 2015. The current usage metrics is available 48-96 hours after online publication and is updated daily on week days.
Initial download of the metrics may take a while.